Tag Archive for: Data Quality

Greenwashing, or the presenting of misinformation to create a sustainable image, is common among organizations. While many consumers may not be aware with the term greenwashing, they are aware of how common it is. In fact, consumers are so aware of this trend that they’re overwhelmingly skeptical of all organizations presenting themselves as sustainable. Four out of every five consumers have expressed skepticism of organizations claiming to be sustainable. So, how does your company express your sincere desire to take steps that are sustainable for the environment? With accurate and transparent data.

Avoid Green Skepticism and Greenwashing with Locus

With 2/3 of consumers seeking out companies that emphasize sustainable practices, the temptation to greenwash is certainly enticing. Sometimes it comes in the form of making irrelevant claims, like saying a product is free of something that is banned (like CFCs). Other times it comes in the form of half-truths, like saying that a product is sustainably sourced, despite the manufacture of the product being unsustainable or harmful to the environment. Any way you look at it, the demand for sustainable products is so high, as is the temptation to greenwash. The truest, and least disputable way to combat greenwashing is by collecting and reporting your data accurately.

Sustainability is now a broad umbrella term that encompasses not only environmental practices, but social and corporate governance as well, better known as ESG. This broadness reflects a change in consumer attitudes from generation to generation, perceiving more than environmental practices as important while holding environmental practices to the microscope. In fact, over 75% of Gen X consumers say that they have to trust a brand before purchasing from them, and over 85% of Millennial and Gen Z consumers say they same. This trust encompasses everything from the use of organic ingredients to company wellness practices, and is reinforced with buying practices. To do environmental, social, and corporate governance right, organizations have taken a data-first approach.

Credible ESG Reporting with Locus

With Locus Technologies, you can take concrete steps towards achievable ESG goals. By taking a fully-digital approach, your organization can make the transformation by maintaining full visibility of raw sustainability data, calculations, and other factors, and also keeping data easily accessible and traceable. Reports are fully traceable back to the source, and are indisputable, allowing for increased trust from consumers or anyone else who has a stake in this information. Given that 7/10 consumers are willing to pay a premium to sustainable-minded companies who are fully transparent with their efforts, this move can provide a significant return on investment in the short term.

The benefits of data centralization also go beyond combatting greenwashing. A fully-digital and streamlined process will improve your ability to handle the data appropriately, and will ease any auditing and reporting responsibilities moving forward, making the entire process cheaper and faster.

Avoid Green Skepticism and Greenwashing with Locus

With brand loyalty and purchasing decisions being reliant on sustainable decisions, the move to accurate and transparent data management is key. By implementing Locus Technologies ESG software, your organization can employ cutting-edge solutions to combat greenwashing by promoting your sustainability goals and actions transparently and accurately.

Request an online demo of our ESG solutions

    Name

    Company Email

    Phone

    Tell us about your company's needs

    Locus is committed to preserving your privacy.

    Locus Environmental Information Management (EIM) is the leading cloud-based application for managing and reporting environmental data. EIM allows users to gain control and insights into any analytical data, automate laboratory and field data collection, and ditch the patchwork of paper forms, spreadsheets, and disjointed databases for a centralized system. We have highlighted 5 key usability features that allow users to get the most out of their investment.

    Locus Usability - Easy Searches

    Easy Searching

    Throughout EIM, users have many opportunities to create search criteria, then pull up the records that match their data filters. A recent addition to EIM has been well received as it is a game-changer for simplicity. Located to the right of the main menu is a search box. Type in the name of a parameter, then click the resulting View Parameter link. You will see all the relevant information on the parameter, including parameter type, whether it is an aggregate parameter or not, site assignment, molecular weight, toxicity equivalence factor, and so forth. Click the View Matching Field Sample Results link, and you will see all the lab results that are stored in EIM for your selected site and analyte. If the parameter is a field measurement, you will see all applicable field measurements. If a parameter can be either a field measurement or lab analyte, you will see both field readings and laboratory results for the parameter.

    Suppose your entry in the search box is a sampling location rather than the name of a parameter. In that case, you will see matching field measurements, sample collection data, analytical results, and groundwater readings for the indicated location.

    Locus Usability - Rolling Upgrades

    Rolling Upgrades

    Think of the frustration your users or administrators may have experienced graduating from Windows XP to Windows 7 and 8 then 10. We guarantee this will not be repeated with our suite of products. Our Software has no version numbers. Rolling upgrades (included in License) are performed for brief periods during non-standard working hours. These updates will not hide or bury existing features. Over time, the interface may change to take advantage of new tools, but this will be done in a measured manner to improve the user experience. What we strive for is to never have a formerly working function break. If you have a recent vintage browser, you should have access to all functionality that comes with our Software both before and after a release.

    In line with this advantage of our products, Locus is not dependent on maintaining links to other software packages. This is not the case for some of our competitors who rely on links to third-party packages to perform data validation, plotting, and reporting.

    Locus Usability - User Empowerment

    User Empowerment

    Almost all of the tasks that are required to manage our products can be done by our customers. This includes adding new users, permissions, and roles; new valid values; new action limits and screening criteria; new custom reports; editing or deleting groups of records; adding new tables to audit; and creating new EDD formats. The few tasks that Locus must be involved include rollbacks of the database, adding new custom fields and data checks, and developing new functionalities.

    Customers who adopt EIM typically replace a series of spreadsheets that have grown more unwieldy by the year or a homegrown database built with a lower-end product like Access. The keepers or administrators of these spreadsheets and homegrown databases are sometimes concerned about losing access and control. There is no doubt that a cloud-based system that multiple clients access must have rigid controls in place to assure data integrity and completeness. Still, we go to great lengths to accommodate “power users,” allowing them to run their SQL statements in our Custom Query module. This tool is widely used and appreciated by users who formerly managed in-house databases at DOE facilities, large water utilities, environmental consultancies, and leading oil and chemical companies. Finally, and most importantly, Locus is a partner with our customers; if you are not successful with EIM, no one “wins.”

    Locus Usability - User Interface

    Interface Consistency and Simplicity: EIM Grids

    The basic grid that EIM uses to display data is pervasive throughout the system, appearing in multiple places under each of the Setup, Field, Input, Analysis, Reporting, and Visualization main menu options. This grid is mighty. With it, you can filter on individual columns by clicking on a list of values below the column header. You can also sort the values in any column by clicking on an up or down arrow in the column header. You can choose to display 10–1000 records at a time. Other features include an advanced search option, the ability to reorder/select/deselect columns, and the opportunity to export the data displayed in the grid using any of the following export types – CSV, Delimited, Excel, PDF, KMZ, Shapefile, or XML – or you can copy the dataset to your clipboard. The power and ease of use of this grid, coupled with its presence throughout EIM, make the system easy to learn and use for users of all ability levels.

    The usability of the grid is taken to a new level in several places in EIM, where you pull up a set of analytical records that meet the selection criteria that you have specified. When you then click on the map icon in the bottom left corner of the grid, EIM takes you directly to Locus’ GIS module, where the results pulled up on the grid are displayed on a map of your site next to their sampling locations.

    Locus Usability - Save and Reuse Work

    Saving and Reusing Your Work

    While you can often get to the data you need in EIM in a few steps, this is not always the case. Your selection criteria may be complicated, involving multiple fields and entries in the database. Most grids have a default set of fields that are displayed in a predetermined order. You may prefer to reorder these, include additional fields, or remove some of the default selections. If you need a highly formatted instead of a simple tabular report that does not yet exist in EIM, you will need to spend more time inputting the specifications for the report. How can you minimize your effort? You can do so by naming and then saving your selections for repeated use at later times. When you do so, you must tell EIM whether these saved inputs are for private or public use. This feature of EIM saves time, reduces keystrokes, and prevents mistakes (get it right once, then reuse as needed). And, enhances user adoption as power users can create and share the reports their users need most often.

    [sc_button link=”https://ltweb-stage.locustec.com/applications/environmental-information-management/” text=”Learn more about Locus EIM” link_target=”_self” centered=”1″]

    The recent year of lockdowns pushed many daily activities into the virtual world. Work, school, commerce, the arts, and even medicine have moved online and into the cloud. As a result, considerably more resources and information are now available from an internet browser or from an application on a handheld device. To navigate through all this content and make sense of it, you need the ability to quickly search and get results that are most relevant to your needs.

    You can think of the web as a big database in the cloud. Traditionally, database searches were done using a precise syntax with a standard set of keywords and rules, and it can be hard for non-specialists to perform such searches without learning programming languages. Instead, you want to search in as natural a matter as possible. For example, if you want to find pizza shops with 15 miles of your house that offer delivery, you don’t want to write some fancy statement like “return pizza_shop_name where (distance to pizza shop from my house < 15 miles) and (offers_delivery is true). You just want to type “what pizza shops within 15 miles of my house offer delivery?” How can this be done?

    Search Engines

    Enter the search engine. While online search engines appeared as early as 1990, it wasn’t until Yahoo! Search appeared in 1995 that their usage became widespread. Other engines such as Magellan, Lycos, Infoseek, Ask Jeeves, and Excite soon followed, though not all of them survived. In 1998, Google hit the internet, and it is now the most dominant engine in use. Other popular engines today are Bing, Baidu, and DuckDuckGo.

    Current search engines compare your search terms to proprietary indexes of web page and their content. Algorithms are used to determine the most relevant parts of the search terms and how the results are ranked on the page. Your search success depends on what search terms you enter (and what terms you don’t enter). For example, it is better to search on ‘pizza nearby delivery’ than ‘what pizza shops that deliver are near my house’, as the first search uses less terms and thus more effectively narrows the results.

    Search engines also support the use of symbols (such as hyphens, colons, quote marks) and commands (such as ‘related’, ‘site’, or ‘link’) that support advanced searches for finding exact word matches, excluding certain results, or limiting your search to certain sites. To expand on the pizza example, support you wanted to search for nearby pizza shops, but you don’t want to include Nogud Pizza Joints because they always put pineapple on your pizza. You would need to enter ‘pizza nearby delivery -nogud’. In some ways, with the need to know special syntax, searching is back where it was in the old database days!

    Search engines are also a key part of ‘digital personal assistants’, or programs that not only perform searches but also perform simple tasks. An assistant on your phone might call the closest pizza shop so you can place an order, or perhaps even login to your loyalty app and place the order for you. There is a dizzying array of such assistants used within various devices and applications, and they all seem to have soothing names such as Siri, Alexa, Erica, and Bixby. Many of these assistants support voice activation, which just reinforces the need for natural searches. You don’t want to have to say “pizza nearby delivery minus nogud”! You just want to say “call the nearest pizza shop that does delivery, but don’t call Nogud Pizza”.

    Search engine and digital personal assistant developers are working towards supporting such “natural” requests by implementing “natural language processing”. Using natural language processing, you can use full sentences with common words instead of having to remember keywords or symbols. It’s like having a conversation as opposed to doing programming. Natural language is more intuitive and can help users with poor search strategies to have more successful searches.

    Furthermore, some engines and assistants have artificial intelligence (AI) built in to help guide the user if the search is not clear or if the results need further refinement. What if the closest pizza shop that does delivery is closed? Or what if a slightly farther pizza place is running a two-for-one special on your favorite pizza? The built-in AI could suggest choices to you based on your search parameters combined with your past pizza purchasing history, which would be available based on your phone call or credit charge history.

    Searching in Locus EIM

    The Locus team recently expanded the functionality of the EIM (Environmental Information Management) search bar to support different types of data searches. If a search term fits several search types, all are returned for the user to review.Locus EIM Quick Search

    • Functionality searches: entering a word that appears in a menu or function name will return any matching menu items and functions. For example, searching for ‘regulatory exports’ returns several menu items for creating, managing, and exporting regulatory datasets.
    • Help searches: entering a word or phrase that appears in the EIM help files will return any matching help pages. For example, ‘print a COC’ returns help pages with that exact phrase.
    • Data searches: entering a location, parameter, field parameter, or field sample will return any matching data records linked with that entity. For example, searching for the parameter ‘tritium’ returns linked pages showing parameter information and all field sample results for that parameter. Searching for the location ‘MW-1’ returns linked pages showing all field samples, groundwater levels, field measurements, and field sample results at the location.

    EIM lets the user perform successful searches through various methods. In all searches, the user does not need to specify if the search term is a menu item, help page, or data entity such as parameter or location. Rather, the search bar determines the most relevant results based on the data currently in EIM. Furthermore, the search bar remembers what users searched for before, and then ranks the results based on that history. If a user always goes to a page of groundwater levels when searching for location ‘MW-1’, then that page will be returned first in the list of results. Also, the EIM search bar supports common synonyms. For example, searches for ‘plot’, ‘chart’, and ‘graph’ all return results for EIM’s charting package.

    Locus EIM Chart Search

    By implementing the assistance methods described above, Locus is working to make searching as easy as possible. As part of that effort, Locus is working to add natural language processing into EIM searches. The goal is to let users conduct searches such as ‘what wells at my site have benzene exceedances’ or perform tasks such as ‘make a chart of benzene results’ without having to know special commands or query languages.’

    How would this be done? Let’s set aside for now the issues of speech recognition – sadly, you won’t be talking to EIM soon! Assume your search query is ‘what is the maximum lead result for well 1A?’

    • First, EIM extracts key terms and modifiers (this is called entity recognition). EIM would extract ‘maximum’, ‘lead’, ‘result’, ‘well’, and ‘1A’, while ignoring connecting words such as ‘the’ or ‘for’.
    • Then, EIM categorizes these terms. EIM would be ‘trained’ via AI to know ‘lead’ is mostly used in environmental data as a noun for the chemical parameter, and not a verb. ‘Result’ refers to a lab result, and ‘well’ is a standard sampling location type.
    • EIM then runs a simple query and gets the maximum lead result for location 1A.
    • Finally, EIM puts the answer into a sentence (‘The maximum lead result at location 1A is 300 mg/L on 1/1/2020’) with any other information deemed useful, such as the units and the date.

    A similar process could be done for tasks such as ‘make a chart of xylene results’. In this case, however, there is too much ambiguity to proceed, so EIM would need to return queries for additional clarifications to help guide the user to the desired result. Should the chart show all dates, or just a certain date range? How are non-detects handled? Which locations should be shown on the chart? What if the database stores separate results for o-Xylene, m,p-Xylene, plus Xylene (total)? Once all questions were answered, EIM could generate a chart and return it to the user.

    Locus EIM Search Results

    Natural language is the key to helping users construct effective searches for data, whether in EIM, on a phone, or in the internet. Locus continues to improve EIM by bringing natural language processing to the EIM search engine.

    [sc_button link=”https://ltweb-stage.locustec.com/applications/environmental-information-management/” text=”Learn more about Locus EIM” link_target=”_self” color=”#ffffff” background_color=”#52a6ea” centered=”1″]


    [sc_image width=”150″ height=”150″ src=”16303″ style=”11″ position=”centered” disable_lightbox=”1″ alt=”Dr. Todd Pierce”]

    About the Author—Dr. Todd Pierce, Locus Technologies

    Dr. Pierce manages a team of programmers tasked with development and implementation of Locus’ EIM application, which lets users manage their environmental data in the cloud using Software-as-a-Service technology. Dr. Pierce is also directly responsible for research and development of Locus’ GIS (geographic information systems) and visualization tools for mapping analytical and subsurface data. Dr. Pierce earned his GIS Professional (GISP) certification in 2010.

    Recently, Locus CEO Neno Duplan described the need for credible ESG Reporting, and the evolving corporate, financial, and political drivers leading to the proliferation of ESG reporting. Here, we look at some of the practical aspects of building and maintaining an ESG reporting program.  After leading audits for greenhouse gas emissions and other ESG metrics for the past ten years, I wanted to highlight the pitfalls that many organizations face when it comes to supporting their ESG reports, and provide some solutions to improve their auditability.

    Locus Engineer Laptop

    With the current wave of popularity for Environmental, Social, and Governance (ESG) reporting, many organizations are scrambling to assemble reports that cover these metrics.  While a spreadsheet can be readily put together with enterprise-level totals for emissions, resource consumption, community involvement and other metrics, most of those reports won’t stand up to a full audit process. And increasingly savvy investors and stakeholders aren’t necessarily willing to take these reports at face value.

    Whether you are getting started on a new ESG reporting program for your organization, or transforming an existing CSR program to cover ESG elements, it is critical to plan ahead for ensuring your final report is audit-ready. That means not only maintaining full visibility for the raw data, calculations, and various factors that went into the report, but also making that data easily accessible and traceable. Consider the case where a stakeholder is comparing two ESG reports where the overall metrics are similar. But one of the reports has a fully transparent data flow back to the source, and the other report can only be verified through a lengthy documentation request to a consultant. Although the final reports may be similar, the stakeholder gains more trust with less effort when the supporting data is readily available.

    Locus Sustainability Metrics

    There is quite a bit of uncertainty over how comprehensive ESG audits should be. Current audit protocols for ESG reporting vary widely. Organizations like the Center for Audit Quality have put forth guidance on how ESG reports could be audited. However, there are no strict requirements and little consensus on what should or should not be included in the audit of an ESG report. Established reporting frameworks like GRI, SASB, and TCFD have programs in place for assurance of those reports, which include a third-party audit for the accuracy and completeness of that data.  However, organizations have the choice of achieving either limited assurance or reasonable assurance, and they may choose to have only select metrics or disclosures audited, or they may opt to undergo a more thorough examination that covers the full report. That flexibility is likely to change, however, as stakeholders apply additional pressure for better quality and reliability in ESG reports.

    So how do you go about developing an ESG program that can meet current and potential future audit requirements?  Based on my auditing experience, here are a few key concepts to keep in mind:

    [sc_icon_with_text icon=”cloud” icon_shape=”circle” icon_color=”#ffffff” icon_background_color=”#52a6ea” icon_size=”big” level=”h3″]

    1. Centralize your data flow

    Centralize your data flow, with consistent data quality controls. A unified data collection program is key to streamlining the audit process and having greater confidence in your report. Historically, reporting for ESG has been the responsibility of multiple departments with little intercommunication. The result of that separation is widely different practices when it comes to assuring data quality. Integrations between systems can help and are sometimes the best option to bring together data from different sectors of the ESG report.  But ultimately, a consistent approach to the overall data collection and processing effort will result in a much smoother (and cheaper) audit.[/sc_icon_with_text]

    [sc_icon_with_text icon=”automation” icon_shape=”circle” icon_color=”#ffffff” icon_background_color=”#52a6ea” icon_size=”big” level=”h3″]

    2. Automate data collection

    Automate data collection wherever possible. Auditors know that manual data entry or transcription is typically one of the major weak points in any data collection program. We’re trained to focus in on those parts of the process with additional data sampling and review to find errors.  If you have any opportunities to collect data through automated tools or direct connections to reliable data sources, those tools are the quickest ways to shore up those potential weaknesses, and also have the benefit of substantially reducing your ESG data collection effort.[/sc_icon_with_text]

    [sc_icon_with_text icon=”documents” icon_shape=”circle” icon_color=”#ffffff” icon_background_color=”#52a6ea” icon_size=”big” level=”h3″]

    3. Maintain documentation

    Maintain documentation throughout the data collection process. During one audit years ago, I asked the reporter for their documentation on their electricity consumption, and they pointed to a scribbled sticky note on their wall. Of course, that didn’t quite suffice for audit purposes, and neither does an email from a co-worker, or any number of other data sources that reporters have tried to pass off as their documentation. For inputs that derive from sources outside your organization, like utility invoices or supplier surveys, data are considered more reliable if they are directly tied to a financial transaction between entities that do not share ownership. The general thought is that if the data quality was considered sufficient to exchange money based on the value, it can be considered reasonably accurate.  If that is not the case, ideally an attestation, or at least the source’s contact information, should be maintained for each data source. For data inputs derived from internal sources (e.g. meter readings), the documentation will need to include the data itself, as well as information on the devices used and their maintenance (e.g. calibration records).[/sc_icon_with_text]

    [sc_icon_with_text icon=”calculation-engine” icon_shape=”circle” icon_color=”#ffffff” icon_background_color=”#52a6ea” icon_size=”big” level=”h3″]

    4. Avoid black box calculators

    Given the many issues with spreadsheet data handling including lack of unification, security, and error proliferation and persistence, many organizations are correctly concluding that a dedicated software application provides numerous process improvements for ESG reporting. But unfortunately there are many software tools that take the input data and generate an ESG report with little or no visibility into how the input data were processed or calculated. And to an auditor, those part of the process are critical to achieving assurance for an ESG report. Sometimes the data processing steps can be viewed, but they’re buried within the configuration settings and require navigation by a system administrator to extract. In this situation, auditors can try to replicate the calculations from the raw data on their own, and attempt to yield the same results. This approach can work for many accounting metrics, which are largely standardized, and easily replicable from the input data.  However, other metrics like Scope 3 emission calculations can follow a number of different methodologies with different factors. Without knowing which methods and factors were used, the auditor is unlikely to yield the same results. Having a transparent calculation engine that can visualize the data flow and processing can make a huge difference when it comes to your audit.[/sc_icon_with_text]

    Assembling an ESG reporting program is a significant undertaking, and it may be a monumental effort to simply get the report done, especially if you’re just getting your program started. But to fully set yourself up for long-term success, be sure to assess the audit readiness of your ESG program. Even though ESG auditing is not yet fully codified, more formalized audit protocols are expected soon. Some simple considerations early in your program development will make sure you are prepared for whatever those audit requirements may include.

    [sc_image width=”150″ height=”150″ src=”16265″ style=”11″ position=”centered” disable_lightbox=”1″ alt=”Steve Paff”]

    About the Author—J. Wesley Hawthorne, President of Locus Technologies

    Mr. Hawthorne has been with Locus since 1999, working on development and implementation of services and solutions in the areas of environmental compliance, remediation, and sustainability. As President, he currently leads the overall product development and operations of the company. As a seasoned environmental and engineering executive, Hawthorne incorporates innovative analytical tools and methods to develop strategies for customers for portfolio analysis, project implementation, and management. His comprehensive knowledge of technical and environmental compliance best practices and laws enable him to create customized, cost-effective and customer-focused solutions for the specialized needs of each customer.

    Mr. Hawthorne holds an M.S. in Environmental Engineering from Stanford University and B.S. degrees in Geology and Geological Engineering from Purdue University. He is registered both as a Professional Engineer and Professional Geologist, and is also accredited as Lead Verifier for the Greenhouse Gas Emissions and Low Carbon Fuel Standard programs by the California Air Resources Board.

    Maybe you are a user of Locus’ Environmental Software (EIM) and are looking to get more out of our product. Or perhaps you are using another company’s software platform and looking to make a switch to Locus’ award-winning solution. Either way, there are some features that you may not know exist, as Locus software is always evolving by adding more functionality for a range of customer needs. Here are five features of our environmental software that you may not know about:

    1. APIs for Queries

    Locus expanded the EIM application programming interface (API) to support running any EIM Expert Query. Using a drag and drop interface, an EIM user can create an Expert Query to construct a custom SQL query that returns data from any EIM data table. The user can then call the Expert Query through the API from a web browser or any application that can consume a REST API. The API returns the results in JSON format for download or use in another program. EIM power users will find the expanded API extremely useful for generating custom data reports and for bringing EIM data into other applications.

    Locus EIM API

    2. Scheduled Queries for Expert Query Tool

    The Expert Query Builder lets users schedule their custom queries to run at given times with output provided in an FTP folder or email attachment. Users can view generated files through the scheduler in a log grid, and configure notifications when queries are complete. Users can scheduled queries to run on a daily, weekly, monthly, or yearly basis, or to run after an electronic data deliverable (EDD) of a specified format is loaded to EIM. Best of all, these queries can be instantly ran and configured from the dashboard.

    Scheduled Queries in Locus EIM

    Scheduled Queries in Locus EIM

    3. Chart Formatting

    Multiple charts can be created in EIM at one time. Charts can then be formatted using the Format tab. Formatting can include the ability to add milestone lines and shaded date ranges for specific dates on the x axis. The user can also change font, legend location, line colors, marker sizes and types, date formats, legend text, axis labels, grid line intervals or background colors. In addition, users can choose to display lab qualifiers next to non-detects, show non-detects as white filled points, show results next to data points, add footnotes, change the y-axis to log scale, and more. All of the format options can be saved as a chart style set and applied to sets of charts when they are created.

    Chart Formatting in Locus EIM

    Chart Formatting in Locus EIM

    4. Quick Search

    To help customers find the correct EIM menu function, Locus added a search box at the top right of EIM. The search box returns any menu items that match the user’s entered search term.

    Locus EIM Quick Search

    Locus EIM Quick Search

    5. Data Callouts in Locus’ Premium GIS Software

    When the user runs the template for a specific set of locations, EIM displays the callouts in Locus’ premium GIS software, GIS+, as a set of draggable boxes. The user can finalize the callouts in the GIS+ print view and then send the resulting map to a printer or export the map to a PDF file.

    Locus GIS+ Data Callouts

    Locus GIS+ Data Callouts


    [sc_button link=”/applications/environmental-information-management/” text=”See more features” link_target=”_self” color=”ffffff” background_color=”52a6ea” centered=”1″]

    Regardless of the size of your organization or the industry you’re in, chances are that right now artificial intelligence can benefit your EHS&S initiatives in one way or another. And whether you are ready for it or not, the age of artificial intelligence is coming. Forward-thinking and adaptive businesses are already using artificial intelligence in EHS&S as a competitive advantage in the marketplace to great success.

    Locus Artificial Intelligence (AI) for EHS

    With modern EHS&S software, immense amounts of computing power, and seemingly endless cloud storage, you now have the tools to achieve fully-realized AI for your EHS&S program. And while you may not be ready to take the plunge into AI just yet, there are some steps you can take to implement artificial intelligence into your EHS&S program in the future.

    Perhaps the best aspect of preparing for AI implementation is that all of the steps you take to properly bring about an AI system will benefit your program even before the deployment phase. Accurate sources, validated data, and one system of record are all important factors for any EHS&S team.

    Accurate Sources

    Used alongside big data, AI can quickly draw inferences and conclusions about many aspects of life more efficiently than with human analysis, but only if your sources pull accurate data. Accurate sources data will help your organization regardless of your current AI usage level. That’s why the first step to implementing artificial intelligence is auditing your data sources.

    Sources pulling accurate data can be achieved with some common best practices. First, separate your data repository from the process that analyzes the data. This allows you to repeat the same analysis on different sets of data without the fear of not being able to replicate the process of analysis. AI requires taking a step away from an Excel-based or in-house software, and moving to a modern EHS&S software, like Locus Platform that will audit your data as it is entered. This means that anything from SCADA to historical outputs, samples, and calculations can be entered and vetted. Further, consider checking your data against other sources and doing exploratory analysis to greater legitimize your data.

    Validated Data

    AI requires data, and a lot of it—aggregated from multiple sources. But no amount of predictive analysis or machine learning is going to be worth anything without proper data validation processes.

    Collected data must be relevant to the problem you are trying to solve. Therefore, you need validated data, which is a truly difficult ask with Excel, in-house platforms, and other EHS&S software. Appropriate inputs, appropriate ranges, data consistency, range checks (to name a few)—are all aspects of data that is validated in a modern EHS&S software like Locus Platform. Without these checks inherent to a platform, you cannot be sure that your data, or your analyses are producing useful or accurate results.

    Possibly the best reason to get started with AI is the waterfall effect. As your data uncovers hidden insights and starts to learn on its own, the more accurate your new data will be and the better your predictions will become.

    One System of Record

    A unified system of record and a central repository for all data means that you see an immediate increase in data quality. Starting with AI means the end of disconnected EHS&S systems. No more transferring data from one platform to another or from pen and paper, just fully-digitized and mobile-enabled data in one platform backed up in the cloud. You also gain the added benefit of being able to access your data in real-time, incorporate compliance/reporting on the fly, and save time and resources using a scalable solution instead of a web of spreadsheets and ad-hoc databases.

    Whether you are ready for AI or not, investing in these otherwise useful steps are necessary for any program looking to harness the power of artificial intelligence. When you are ready to take that next step, you will be well on the path to AI implementation, with a solid data infrastructure in place for your efforts.

    Contact us to get prepared for AI

      Name

      Company Email

      Phone

      Tell us about your company's needs

      Locus is committed to preserving your privacy.

      To learn more about artificial intelligence, view this NAEM-hosted webinar led by Locus experts, or read our study on predicting water quality using machine learning.

      Software as a service (SaaS) databases offer several unique features that allow you to manage your environmental data more thoroughly and efficiently. This infographic highlights twelve key features of SaaS databases for environmental software. 12 Ways SaaS Can Improve Your Environmental Data

      This infographic was created based on a four part series of blog posts on the same topic, which can be read here.

      Contact us to learn more about these benefits

        Name

        Company Email

        Phone

        Tell us about your company's needs

        Locus is committed to preserving your privacy.

        The Importance of User Implementation and Quality Assurance from an EHS&S Software Provider

        After reading about the IowaReporterApp used during the 2020 Iowa caucuses, it struck me how remarkably similar it is in intended function to the EHS&S software developed by my employer, Locus Technologies. Both their application and Locus’ mobile technology collect large quantities of sensitive data from several remote users at multiple facilities, allowing for instant calculation and reporting. What surprised me though, is just how vastly different their user implementation and data management methodology was from what is standard operating procedure at Locus.

        In this blog, I will highlight some of the pitfalls of the IowaReporterApp, and compare it to Locus’ EHS&S software. Note, this article is not a political critique, but is an examination of data collection and data quality methods used during the caucuses.

        Complex data - Data stewardship

        Implementation

        Users were introduced to the IowaReporterApp just days before the caucuses and received no app-specific training. Many users were downloading the application on the night of the caucuses.

        The Iowa caucuses have been held biennially for almost a half-century as the first major contest of the primaries. The date of the caucuses was a surprise to no one. As a result, app development deadlines should have given enough time for user implementation, through one-on-one training or presentations with appropriate support staff. If app deadlines were not met, there should have been a fallback to redundant reporting systems, like in the case of Nevada, who were also planning to use the app but have opted out after the debacle in Iowa.

        When Locus introduces new users to our software, we take implementation seriously. Our customer support team is composed of domain experts who have actively built and used Locus software. We know the deadlines and the problems users typically face during the implementation process. From one-on-one and on-site training to quick turnaround, our support team does everything they can to ensure that users are comfortable with our product as soon as possible.

        Complex data - Software quality assurance

        Untested Software/Quality Assurance

        User implementation deadlines are all the more important given that the software had no real-world use to this point. While it is not advisable to go live with untested software, at the very least, having users stress test a product before field-use could have staved off a few issues.

        This is something we see frequently with newer products and newer companies. Locus has over 20 years of experience creating EHS&S software used by U.S. government organizations and Fortune 500 companies. Our quality assurance team rigorously tests any update we bring to customers and doesn’t rush changes to sell a platform update, since every user is always on the same version of Locus software.

        Complex data - Data redundancy

        Data Redundancy

        No one can question that Excel or Google Spreadsheets can perform math correctly, but what is frequently overlooked or not even considered, are the macros, custom functions, and calculations that are often added to spreadsheets when deployed for managing data and other tasks. If one fails, there need to be backups for reporting and storing data.

        When the untested application predictably failed, users flocked to the phone lines as a redundancy. Manual data collection on such a scale created confusion and could not carry the load, and had no way of accounting for errors in data entry. At Locus, we understand the importance of EHS&S data, and maintain backups and full audit trails for all critical data, with quick restoration available so you can keep going if anything should happen.

        Complex data - Security

        Security

        The IowaReporterApp was not released in time to get approval in Apple’s app store, and it was sent out through beta testing platforms which required suspension of smartphone security settings.

        ProPublica, a nonprofit organization who produces public interest investigative journalism, did a report on the security of the IowaReporterApp after the Iowa Caucuses. Shockingly, they found security problems to be “elementary” and that the app was so insecure that vote totals, passwords, and other sensitive information could have been intercepted or changed. Luckily, there seems to be no evidence of hacking or tampering with results.

        Locus understands the need for security with sensitive data, and hosts our entire infrastructure in the most secure and reliable cloud, Amazon Web Services. AWS has an unmatched portfolio of cloud services that Locus fully utilizes to the benefit of their customers.

        Complex data - Data entry

        Summary

        Overall, I think that the mishaps related to the IowaReporterApp show just how easy it is for a data collection and management application to fail if not properly implemented and ran by those with years of practical expertise. Subverted data quality will always be extremely costly to your organization, both financially and otherwise, and should be avoided unequivocally.


        Locus Technologies was founded in 1997. Locus’ environmental data management software currently handles over a half billion sensitive records taken from over one million unique locations and is used hundreds of organizations including the government agencies and Fortune 500 companies. Aaron Edwards received his bachelor’s degree in Political Science from UNC Asheville and is Marketing Associate for Locus Technologies. He is an active voter, and is unaffiliated with any political party.

        [sc_button link=”https://ltweb-stage.locustec.com/why-locus/” text=”Why Locus?” link_target=”_self” color=”#ffffff” background_color=”#52a6ea” centered=”1″]

        At Locus Technologies, we’re always looking for innovative ways to help water users better utilize their data. One way we can do that is with powerful technologies such as machine learning. Machine learning is a powerful tool which can be very useful when analyzing environmental data, including water quality, and can form a backbone for competent AI systems which help manage and monitor water. When done correctly, it can even predict the quality of a water system going forward in time. Such a versatile method is a huge asset when analyzing data on the quality of water.

        To explore machine learning in water a little bit, we are going to use some groundwater data collected from Locus EIM, which can be loaded into Locus Platform with our API. Using this data, which includes various measurements on water quality, such as turbidity, we will build a model to estimate the pH of the water source from various other parameters, to an error of about 1 pH point. For the purpose of this post, we will be building the model in Python, utilizing a Jupyter Notebook environment.

        When building a machine learning model, the first thing you need to do is get to know your data a bit. In this case, our EIM water data has 16,114 separate measurements. Plus, each of these measurements has a lot of info, including the Site ID, Location ID, the Field Parameter measured, the Measurement Date and Time, the Field Measurement itself, the Measurement Units, Field Sample ID and Comments, and the Latitude and Longitude. So, we need to do some janitorial work on our data. We can get rid of some columns we don’t need and separate the field measurements based on which specific parameter they measure and the time they were taken. Now, we have a datasheet with the columns Location ID, Year, Measurement Date, Measurement Time, Casing Volume, Dissolved Oxygen, Flow, Oxidation-Reduction Potential, pH, Specific Conductance, Temperature, and Turbidity, where the last eight are the parameters which had been measured. A small section of it is below.

        Locus Machine Learning - Data

        Alright, now our data is better organized, and we can move over to Jupyter Notebook. But we still need to do a bit more maintenance. By looking at the specifics of our data set, we can see one major problem immediately. As shown in the picture below, the Casing Volume parameter has only 6 values. Since so much is missing, this parameter is useless for prediction, and we’ll remove it from the set.

        Locus Machine Learning - Data

        We can check the set and see that some of our measurements have missing data. In fact, 261 of them have no data for pH. To train a model, we need data which has a result for our target, so these rows must be thrown out. Then, our dataset will have a value for pH in every row, but might still have missing values in the other columns. We can deal with these missing values in a number of ways, and it might be worth it to drop columns which are missing too much, like we did with Casing Volume. Luckily, none of our other parameters are, so for this example I filled in empty spaces in the other columns with the average of the other measurements. However, if you do this, it is necessary that you eliminate any major outliers which might skew this average.

        Once your data is usable, then it is time to start building a model! You can start off by creating some helpful graphs, such as a correlation matrix, which can show the relationships between parameters.

        Locus Machine Learning - Corr

        For this example, we will build our model with the library Keras. Once the features and targets have been chosen, we can construct a model with code such as this:

        Locus Machine Learning - Construct

        This code will create a sequential deep learning model with 4 layers. The first three all have 64 nodes, and of them, the initial two use a rectified linear unit activation function, while the third uses a sigmoid activation function. The fourth layer has a single node and serves as the output.

        Our model must be trained on the data, which is usually split into training and test sets. In this case, we will put 80% of the data into the training set and 20% into the test set. From the training set, 20% will be used as a validation subset. Then, our model examines the datapoints and the corresponding pH values and develops a solution with a fit. With Keras, you can save a history of the reduction in error throughout the fit for plotting, which can be useful when analyzing results. We can see that for our model, the training error gradually decreases as it learns a relationship between the parameters.

        Locus Machine Learning - Construct

        The end result is a trained model which has been tested on the test set and resulted in a certain error. When we ran the code, the test set error value was 1.11. As we are predicting pH, a full point of error could be fairly large, but the precision required of any model will depend on the situation. This error could be improved through modifying the model itself, for example by adjusting the learning rate or restructuring layers.

        Locus Machine Learning - Error

        You can also graph the true target values with the model’s predictions, which can help when analyzing where the model can be improved. In our case, pH values in the middle of the range seem fairly accurate, but towards the higher values they become more unreliable.

        Locus Machine Learning - Predict

        So what do we do now that we have this model? In a sense, what is the point of machine learning? Well, one of the major strengths of this technology is the predictive capabilities it has. Say that we later acquire some data on a water source without information on the pH value. As long as the rest of the data is intact, we can predict what that value should be. Machine learning can also be incorporated into examination of things such as time series, to forecast a trend of predictions. Overall, machine learning is a very important part of data analytics and the development of powerful AI systems, and its importance will only increase in the future.

        What’s next?

        As the technology around machine learning and artificial intelligence evolves, Locus will be working to integrate these tools into our EHS software. More accurate predictions will lead to more insightful data, empowering our customers to make better business decisions.

        Contact us today to learn how machine learning and AI can help your EHS program thrive

          Name

          Company Email

          Phone

          Tell us about your company's needs

          Locus is committed to preserving your privacy.

          Continued from Part 1

          Complex data - Data quality2) Data quality is better with databases

          Since 2002, a dedicated group of Locus employees has been involved with migrating data into EIM from spreadsheets provided to us by customers and their consultants. As such, we have firsthand experience with the types of data quality issues that arise when using spreadsheets for entering and storing environmental data.

          Here is just a small selection of these issues:

          • Locations with multiple variations of the same ID/name (e.g., MW-1, MW-01, MW 1, MW1, etc.)
          • Use of multiple codes for the same entity (e.g., SW and SURFW for surface water samples)
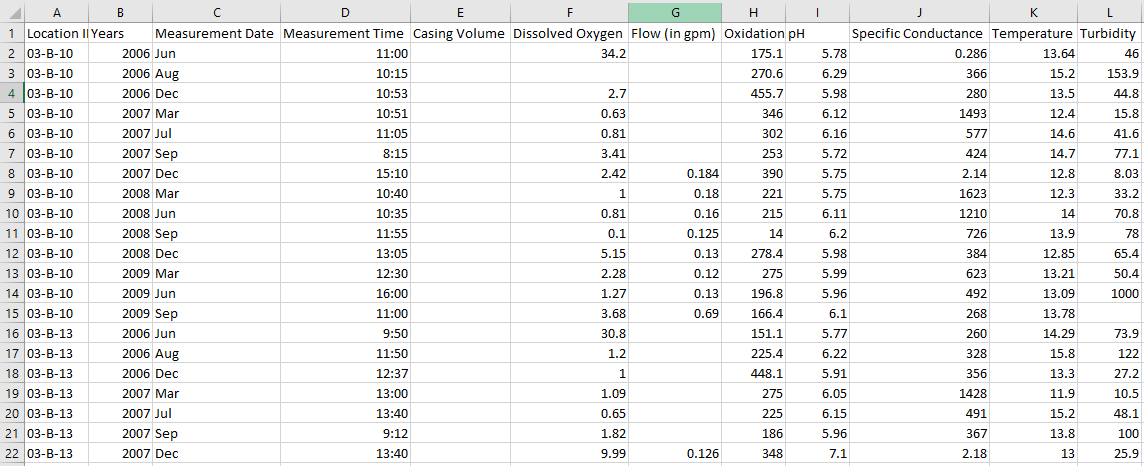
          • Loss of significant figures for numeric data
          • Special characters (such as commas) that may cause cells to break unintentionally over rows when moving data into another application
          • Excel’s frustrating insistence (unless a cell format has been explicitly specified) to convert CAS numbers like “7440-09-7 (Potassium)” into dates (“9/7/7440”)
          • Bogus dates like “November 31” in columns that have do not have date formats applied to them
          • Loss of leading zeros associated with cost codes and projects numbers (e.g., “005241”) that have only numbers in them but must be stored as text fields
          • The inability to enforce uniqueness, leading to duplicate entries
          • Null values in key fields (because entries cannot be marked as required)
          • Hidden rows and/or columns that can cause data to be shifted unintentionally or modified erroneously
          • Bogus numerical values (e.g., “1..3”, “.1.2”) stored in text fields
          • Inconsistent use of lab qualifiers— in some cases, these appear concatenated in the same Excel column (e.g., “10U, <5”) while in other cases they appear in separate columns

          With some planning and discipline, you can avoid some of these problems in Excel. For example, you can create dropdown list boxes to limit the entries in a cell to certain values. However, this is not standard practice as most spreadsheets we receive come with few constraints built into them.

          While databases are indeed not immune to data quality issues, it is much easier for database designers to impose effective constraints on users’ entries. Tasks such as limiting the values in a column to selected entries, ensuring that values are valid dates or numbers, forcing values to be entered in selected fields, and preventing duplicate records from being entered are all easy to implement and standard practice in databases.

          However, properly designed databases can do even more. They can check that various combinations of values make sense—for example:

          • They can prevent users from entering analysis dates that are earlier than the associated sample dates.
          • They can verify that numerical entries are within a permitted range of values and make sense based on past entries. This is so popular its even part of our Locus Mobile app for collecting field data.

          Databases also provide the ability to verify the completeness of your data:

          • Have all samples been collected?
          • Have all analyses been performed on a sample?
          • Are there any analytes missing from the laboratory’s findings?

          You can specify such queries to run at any time. Replicating these checks within Excel, while not impossible, is simply not something most Excel users have the time, skill, or desire to build.


          Complex data - Data redundancy3) It’s easier to prevent data duplication and redundancy when your data resides in your database

          One of the most striking differences between spreadsheets and databases is the prevalence of redundant information in spreadsheets. Consider, for example, these three tables in EIM:

          1. LOCATION
          2. FIELD_SAMPLE
          3. FIELD_SAMPLE_RESULT

          In this subset of their columns, “PK” signifies that the column is a member of the “primary key” of the table. The combination of values in these columns must be unique for any given record.

          Complex data - Table - Primary key

          The two columns LOCATION_ID and SITE_ID can be used to link (join) the information in the FIELD_SAMPLE table. Furthermore, FIELD_SAMPLE_ID and SITE_ID can be used to link the information in FIELD_SAMPLE_RESULT to FIELD_SAMPLE. Because these links exist, we only need to store the above attributes of a given location or field sample once— in one table. This is very different from how data is handled in a single spreadsheet.

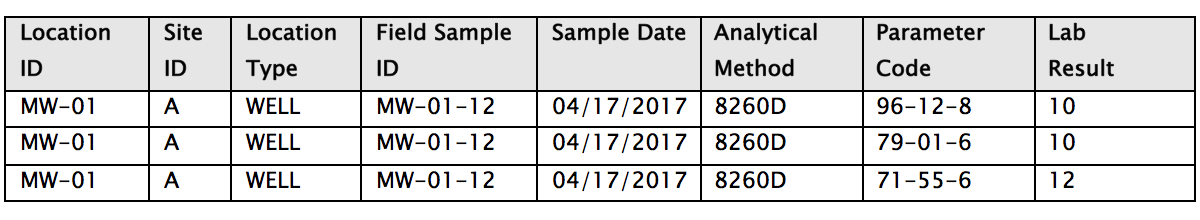
          Let’s compare how the data in a few of these columns might appear in a single spreadsheet compared to a database. We’ll look at the spreadsheet first:

          Complex data - Location Table

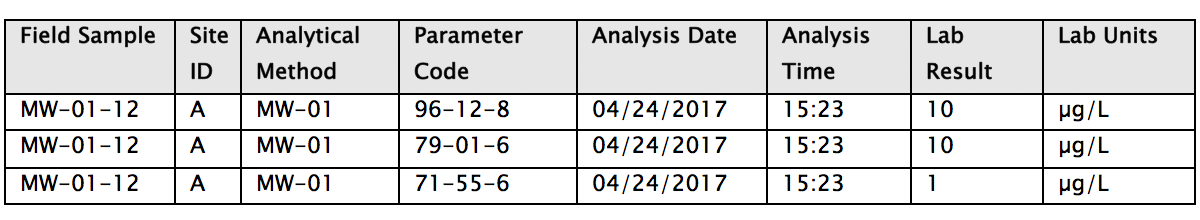
          Next, let’s see how this information would be stored in a database. Here we can see more fields since we’re not as constrained by width.

          First, the LOCATION table:

          Complex data - Location ID Table

          Then, FIELD_SAMPLE:

          Complex data - Field Sample Table

          Lastly, FIELD_SAMPLE_RESULT:

          Complex data - Field Sample Result Table

          Note one of the most striking differences between the spreadsheet and the database tables above is that much redundant information is included in the spreadsheet. The Location Type of “WELL” is repeated in every record where location MW-01 appears, and the sample date of “04/17/2017” is repeated wherever sample MW-01-12 is present. Redundant information represents one of the most significant drawbacks of using spreadsheets for storing large amounts of data when many of the data values themselves (e.g., LOCATION_ID and FIELD_SAMPLE_ID above) have multiple attributes that need to be stored as well.

          Most spreadsheet data that we have received for import into EIM have consisted of either:

          1. Multiple worksheets of the same or similar formats, all containing a combination of sampling and analytical data
          2. A single worksheet containing tens of thousands of rows of such data

          Occasionally, customers have sent us multiple spreadsheets containing very different types of data, with one or more hosting sample and analytical results, and others containing location, well construction, or other supporting data. However, this is atypical; in most of the migrations that we have performed, redundant data is pervasive in the spreadsheet’s contents and inconsistencies in entries are common.

          Entering new records in a spreadsheet structured like the example above requires that the attributes entered for LOCATION_ID and FIELD_SAMPLE_ID be consistent across all records whose values are the same in these columns.

          The real problems surface when you have to edit records. You must correctly identify all affected records and change them all identically and immediately.

          Sounds relatively straightforward, doesn’t it?

          In fact, judging by what we have seem in our data migrations, discrepancies invariably creep into spreadsheets when edits are attempted. These discrepancies must be resolved when moving the data into a database where constraints prohibit, for example, a single sample from having multiple sample dates, times, purposes, etc.

          In addition, audit trails are all but nonexistent in Excel. Many users tend to save the edited version with a new filename as a crude form of audit tracking. This can quickly lead to a data management nightmare with no documented audit tracking. Just as important, almost all our customers, especially customers involved with regulatory reporting, require audit tracking. This is typically required on sites that may be involved in litigation and decisions are made on the health and safety risks of the site necessitating defensible and unimpeachable data.


          Complex data - Entity relationships4) Entity relationships are more manageable in databases

          The discussion of data duplication and redundancy touches on another significant difference between databases and spreadsheets—how entity relationships are handled.

          Excel stores data in a two-dimensional grid. While it is possible to create relationships between data in different worksheets, this is not the norm and there are many limitations. More often, as we have stated elsewhere, Excel users tend to store their data in a single spreadsheet that grows increasingly unwieldy and hard to read as records are added to it.

          Let’s consider some of the relationships that characterize environmental sampling and analytical data:

          • Sampling locations are associated with sites or facilities—or, for our water utility customers, individual water systems. They may also belong to one or more planned sampling routes.
          • Different sampling locations have their own analytical and field measurement requirements.
          • Individual samples may be associated with one or more specific permits or regulatory requirements.
          • Trip, field, and equipment rinsate samples are linked to one or more regular field samples.
          • Analytical results are assigned to analysis lots and sample delivery groups (SDGs) by the laboratory.
          • Analysis lots and SDGs are the vehicle for linking laboratory QC samples to regular samples.
          • Analytical parameters are associated with one or more regulatory limits.
          • Individual wells are linked to specific boreholes and one or more aquifers.

          Modeling and building these relationships in Excel would be quite difficult. Moreover, they would likely lack most of the checks that a DBMS offers, like preventing orphans (e.g., a location referenced in the FIELD_SAMPLE table that has no entry in the LOCATION table).


          Complex data - Reporting & Integration
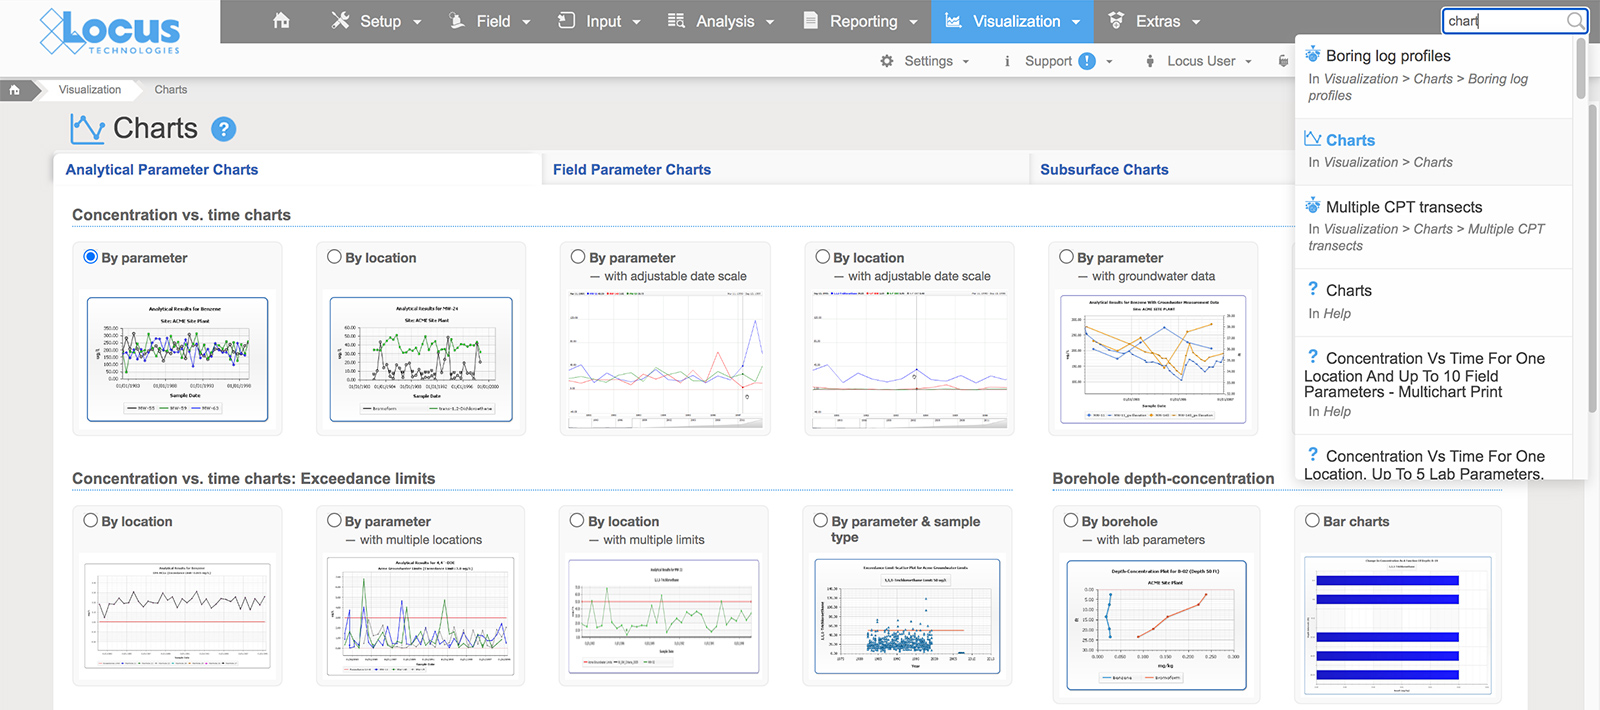
5) Data reporting and integration is faster and easier with databases

          How do you create a report in Excel? If you’re working with a single spreadsheet, you use the “Data Filter” and “Sort” options to identify the records of interest, then move the columns around to get them in the desired sequence. This might involve hiding some columns temporarily.

          If you make a copy of your data, you can delete records and columns that you don’t want to show. If your data is stored in multiple spreadsheets, you can pull information from one sheet to another to create a report that integrates the different types of data housed in these spreadsheets. But this is a somewhat tedious process for all but the simplest of reports.

          Let’s contrast this drudgery with the simplicity and power offered by relational databases.

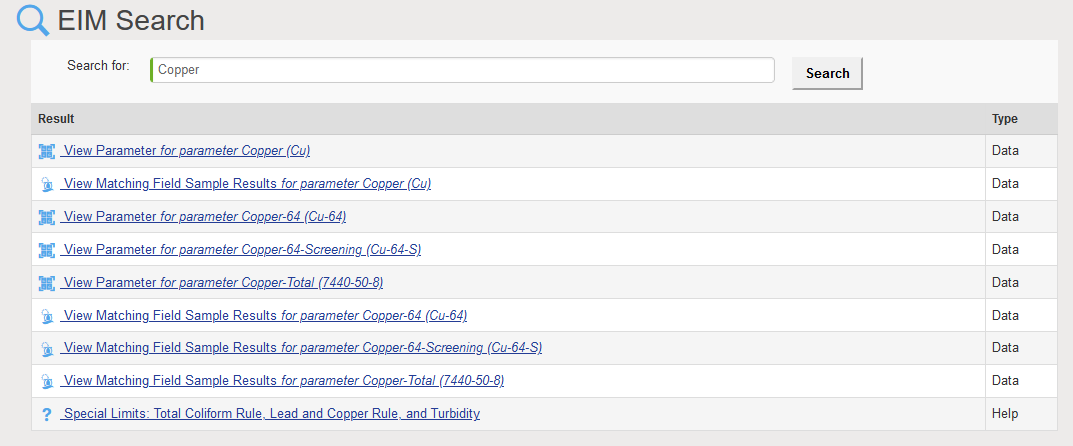
          In Locus EIM, for example, you pick the primary and secondary filter categories that you want to use to restrict your output to the records of interest. Then, you select the specific values for these data filter categories (usually from dropdowns or list-builder widgets). There is no limit on how many categories you can filter on.

          Typically, you then choose a date range. Lastly, you pick which data columns you want to view, and in what order. These columns can come from many different tables in the database. For ease of selection, these also appear in dropdowns or list-builder widgets.

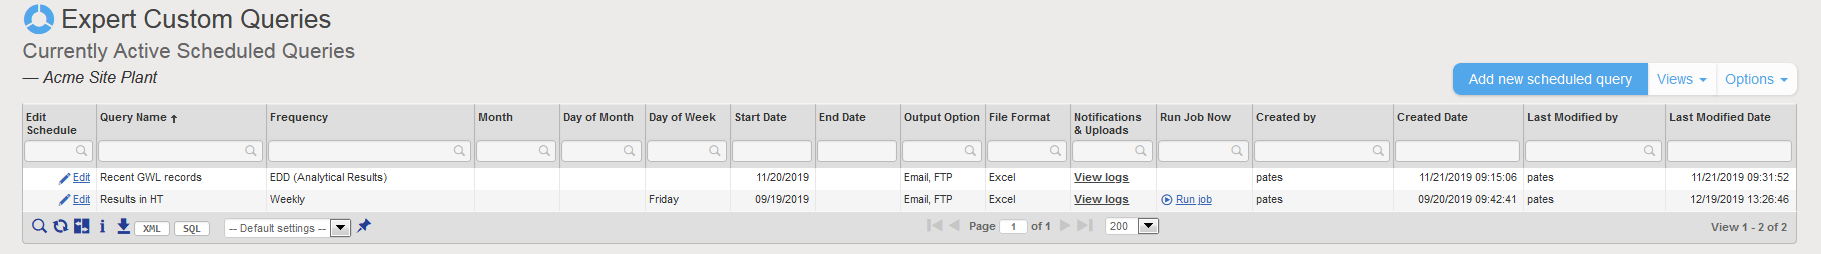
          When you have made your filter selections, Locus EIM pulls up the records matching your selection criteria in a data grid. You can further filter the records by values in specific columns in this grid, or hide or rearrange columns. If you want to share or keep a record of these data, you can export the contents of the displayed grid to a text file, Excel, XML, PDF, or copy to your clipboard.

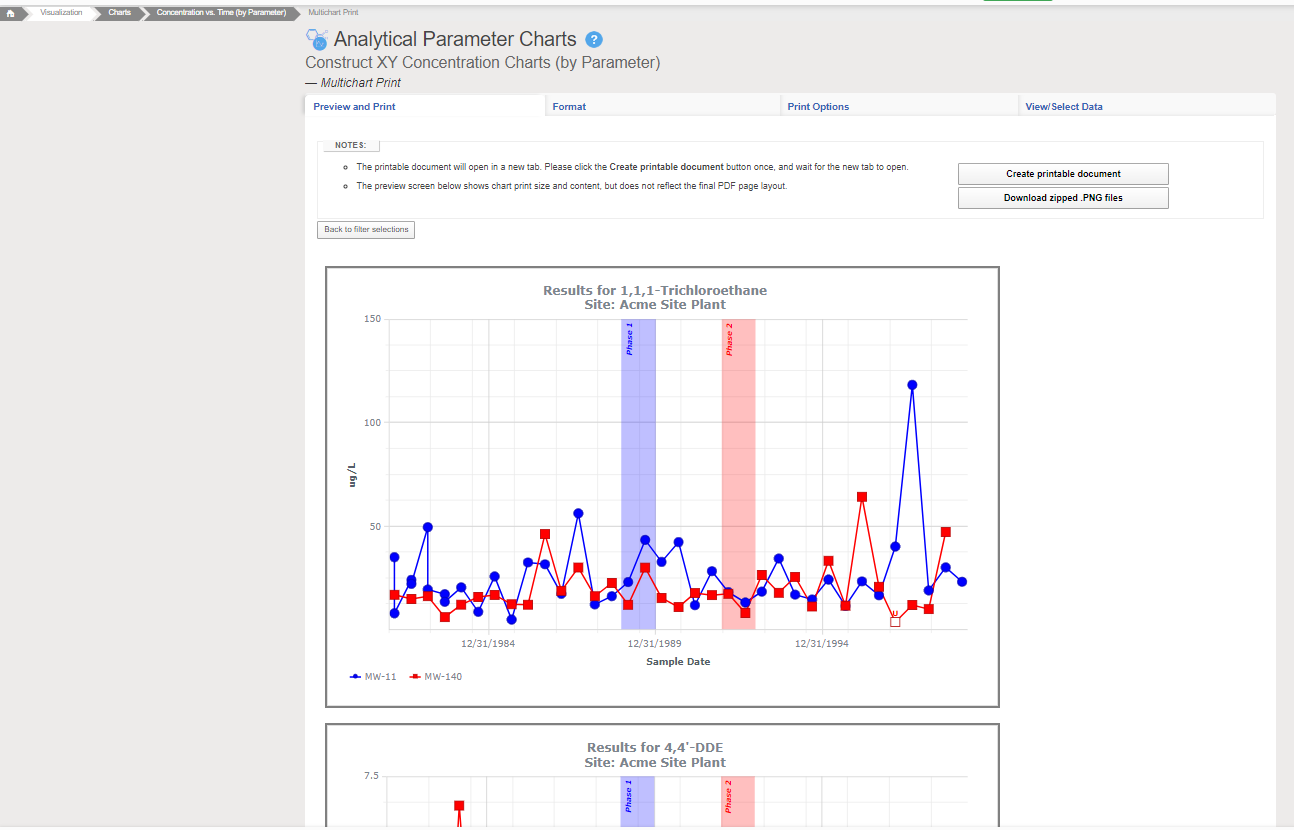
          The list of reports spans all the major types of data stored in Locus EIM, including location and sample collection information, chain of custody and requested analyses data, analytical results, field measurements, and well and borehole data. Additional reports provide options to perform statistical calculations, trend analyses, and comparisons with regulatory and other limits.

          In short, when it comes to generating reports, databases are superior to spreadsheets in almost every aspect. However, that doesn’t mean spreadsheets have no role to play. Many Locus EIM users charged with creating an ad hoc report prefer to download their selected output to Excel, where they apply final formatting and add a title and footer.  Although, with some of the newer reporting tools, such as Locus EIM’s new enhanced formatted reports, that functionality is also built into the DBMS. The more sophisticated the database, the more advanced and robust reporting options will be available.

          12 reasons why commercial SaaS databases are ideal

          Make sure to read the entire series to find out about 12 reasons commercial SaaS databases excel at managing complex environmental data!

          About the author—Gregory Buckle, PhD, Locus Technologies

          Gregory Buckle, PH.D.Dr. Buckle has more than 30 years of experience in the environmental field, most of which have been devoted to the design, development, and implementation of environmental database management systems. When he joined Locus in 1999, he was responsible for building and deploying Locus’ cloud-based EIM software. He was also instrumental in customizing EIM for the water utility industry and developing EIM’s powerful Sample Planning and Data Validation modules. The latest iteration of the Sample Planning module that Dr. Buckle built is currently being used by Los Alamos National Laboratory and San Jose Water Company to plan and schedule thousands of samples per year.


          About the author—Marian Carr, Locus Technologies

          Marian CarrMs. Carr is responsible for managing overall customer solution deployments and customer relationships with Locus’ government accounts. Her career at Locus includes heading the product development team of the award-winning cloud-based environmental ePortal solution as well as maintaining and growing key customer accounts with Locus’ Fortune 100 enterprise deployments. In addition, Ms. Carr was instrumental in driving the growth and adoption of the Locus EIM platform with key federal and water organizations.


          Have a question about Locus’ cloud-based environmental software?

            First name

            Last name

            Email address

            Phone number

            Company

            Job title

            Tell us about your company's needs

            Locus is committed to preserving your privacy.

            Tag Archive for: Data Quality

            Nothing Found

            Sorry, no posts matched your criteria