Exercising best practice is essential when ensuring water quality and conservation. To assist in this effort, Locus’ domain experts have assembled 10 best practices for collecting, managing, visualizing, and reporting critical water data.

For 26 years, Locus Technologies has been helping organizations that serve millions of people a day. Throughout that time, our team of experts have noticed some common red flag with the alternative solutions that are available on the market. The alternatives can be more problematic that helpful, creating data congestion and slowing down your workflow. Your organization deserves a solution that alleviates the burdens of data entry, regulatory compliance, voluntary reporting, and more. Here are the top five signs that your organization is using outdated water software:
1. Using paper form and/or transcribing data more than once
To ensure the highest level of data quality, you should not be risking human error at multiple levels. Enter your data once, and have it audit-ready, set to go on regulatory and voluntary reports, which are created directly from Locus Software.
2. Software support is not led by the specialist.
Support doesn’t end after implementation. What we often hear from our customers when they switch from other providers is that they are delighted with the level of support that Locus brings with our software. Locus is proud to have the expertise and experience to back our software, and if there is anything you need, you can be sure that Locus support can get it done smoothly.
3. The software has regular or unexpected downtimes.
You need reliability. Your software should be available to you on-demand. Locus is proud to be the only environmental software developer to publicly share our uptime, which is over 99.9%. If you are experiencing downtimes at inconvenient times or for long periods, you should switch.
4. It’s not mobile-enabled.
Field collection is key for most organizations managing water quality data. You should be able to enter that data into your system once, and from anywhere, reducing errors and extra time doing the same work twice (or more!). Also, being able to access historical data at your fingertips can help you solve problems on the fly.
5. It doesn’t provide actionable insights.
Sure, you may have all your data collected, but what are you doing with it? If your software is not giving you meaningful findings from analyzing your data, then you are always going to be playing catch-up. Having the tools to help your organization look forward is essential in selecting water data management software.
Want to learn more about our Water Data Management Solution? Reach out to our product specialists today!
There is a need for most water entities to centralize data, and more easily load, share, analyze, and report data. Locus Technologies’ customizable software makes scheduling and collecting routine water samples is made easy by using Locus Mobile and EIM. Below is a list of frequent challenges that customers have encountered during their water sampling process and how they can be solved using the right tools from Locus. or better communications.
Challenge 1: Finding a flexible sampling planning tool
Planning tools need to allow flexibility in terms of different sampling intervals and date ranges, different field and analytical parameters, and account for location grouping. Using a well-designed application can pull together all of this detailed information and can provide a summary view of the individual samples. A manager can easily view sample status, and whether the sample is complete, in process, or planned. A well-designed application can also generate the chain of custody (COC), and lab and sample shipping date information and labels per sample, which is a huge time saver. This type of sample tracking detail seemed to be very useful to many conference attendees to help ensure they are in regulatory compliance with required sampling frequencies. A key feature to look for is an application that is flexible enough that it can allow one-time, unplanned sample events such as water main breaks, customer complaints and schedule changes, and can handle complex multi-year routine sampling with ease. As a plus, it’s easy for you or your manager to know where you stand at any time.

Challenge 2: Eliminating data entry errors caused by hand data entry
Data entry errors and fixing bad data when it was transcribed from field notes to Excel or other programs is a persistent problem with the old way of doing things. Your company needs a better way to streamline the error prone data collection process. Many clients are interested in an alternative to the pencil/paper/clipboard method and had goals to move to tablet or smartphone for data collection. The universal wish list for mobile field applications included:
- Easy to use and set up
- Built in data validation to catch data entry errors at the source
- Direct upload to a data system so the end of the day all the daily samples were in the system with the push of a button
- Prepopulating locations especially for large water systems
- Complete field instructions for samplers on what to collect and where to collect it to eliminate missed samples
- Smart tracking to know on a daily/weekly basis, what samples were collected and what samples were still outstanding
- Integrated with sample planning tools (See challenge 1) to automate the sampling instructions and track the data collection activities vs plan

Challenge 3: Getting the most out of their software, especially regarding updates
Everyone is aware that software updates all the time. Sometimes its security enhancements and sometime feature enhancements or bug fixes. A source of frustration is getting a software update and not knowing what was updated or how best to incorporate a new feature/enhancement into their established process. There was also concern for impact to an established routine with field crews that were used to the existing way of doing things. Even if a functionality improved the workflow, enhancements are only valuable to a user if they understand how to use them and how to incorporate them into their existing process.
Some suggestions from the attendees included:
- Concurrent documentation updates with software updates
- “Quick start” guides for new functionality
- Online training on the new functionality with recording for later viewing
- Heads up on what is coming in the next several months so they can do strategic planning (sharing the roadmap)
- Sandbox environment to test the enhancements before going in production so they can plan how to incorporate the features into their process and train field crews
Mobile applications, which appear very simple to the users, are in reality complex software and require careful integration with the receiving database for a range of complex use cases. This makes rolling out new mobile features challenging for both the developers and the users. Enhanced customer/developer communication along with a sandbox environment can go a long way towards solving some of the inherent issues with rapid innovations and updates associated with cloud and mobile software.
Software tools are available and can solve a lot of the common data management challenges, but know what you want, know the problem you are trying to solve and know it will take some time and effort, but the end result will significantly improve your business processes. Though these challenges are present when choosing a software, Locus Technologies has the experts to help you hurdle the challenges to find the solution that is best for your business.
Request a demo
Send us your contact information and a Locus representative will be in touch to discuss your organization’s needs and provide an estimate, or set up a free demo of our enterprise environmental software solutions.
Environmental Business Journal (EBJ) recognized Locus for ESG software growth and innovation.
MOUNTAIN VIEW, Calif., 2 March 2023 — Locus Technologies, the leading EHS Compliance and ESG software provider, received their 17th consecutive award from Environmental Business Journal (EBJ) for growth and innovation in the field of Information Technology in the environmental software with particular focus on EHS, compliance, sustainability, and ESG.
Locus continues to expand its ESG SaaS solution, including built-in business intelligence tools for interactive, actionable insights into unified EHS compliance and ESG data, forecasting tools predicting future ESG reporting, APIs for utility data sources, and interfaces with third-party systems that house ESG data. Locus’s ESG solutions focus on “enter once, report to many.” enabling companies the efficiency of reporting to multiple organizations and numerous standards from a single dataset. Essential built-in reporting includes state or federal regulations and ESG based on standards, including CDP, GRI, SASB, TCFD, and many others.
“Locus’s pioneering work in integrated ESG reporting and EHS compliance software is paying off. As one of the early SaaS leaders in net-zero digital solutions for ESG reporting, Locus continues to provide value to companies that want to be credible with their carbon reporting and sustainability software.” said Grant Ferrier, president of Environmental Business International Inc. (EBI), publisher of Environmental Business Journal.
“With energy transition, climate resilience, and new federal programs driving business, as well as traditional environmental market drivers in infrastructure, air quality, remediation, water and wastewater it is understandable that companies that offer integrates SaaS platform like Locus has advantage.” added Ferrier.
“As Locus continues to expand our EHS and ESG software we would like to thank EBJ for recognizing Locus again for a 17th consecutive year and for noting the new functionality and growing customer base we achieved in 2022. Locus will continue this trajectory into 2023 with new tools designed to simplify EHS and ESG management in our award-winning Locus software, which offers a single system of record and truth for our customers. Locus SaaS platform enables our customers to manage their carbon transactions and inventory with the same rigor, confidence, and transparency as their financial ones.” said Neno Duplan, the Founder and CEO of Locus Technologies.
Tracking your data is made easy within our software as a service (SaaS), Locus Platform (LP). Your company can take advantage of LP’s mobile-aware browser functions, giving you the capability to do all your fieldwork with your existing phones or tablets. When cellular connections are unavailable or unreliable, Locus also has a Mobile app which supports the offline capabilities you need to keep your workflow going.
Regardless of your mobile approach, each mobile form can be easily configured to capture the data you require in the field such as photos and the sampling results.
Along with easy mobile data collection, Locus Platform can help you to:
- Track and report your daily results, such as chlorine, nitrite and temperature to water treatment operators, for real time adjustments.
- Monitor lab results from routine sampling.
- Flag out of range data in real time for notifications or data entry corrections.
- Analyze data geospatially to understand situations impacting water quality.
- Report average monthly chlorine results.
- Track water quality complaints and illicit discharges overtime.
- Generate Nitrification Reports.
- Prepare Monthly Flushing reports.
Of course, those are not the limits of Locus Platform. Our software can also help you to:
- Track and manage all types of tasks and regulatory commitments.
- Track any type of permit and associated requirements.
- Generate notifications for defined events, such as data entered above limits.
- Produce PDF and Excel reports for regulators and customers.
- Keep all your information in an easy-to-use secure system and basically future proof your program.
Whether in the office, or out in the field, Locus Technologies is with you every step of the way during the tracking process. Contact us to find your solution.
![]()
Request a demo
Send us your contact information and a Locus representative will be in touch to discuss your organization’s needs and provide an estimate, or set up a free demo of our enterprise environmental software solutions.
2022 has given us a wealth of new features and growth! Both of our platforms have undergone improvements to enhance our client’s user experience. Let’s look at all the new features for 2022.

Environmental Information Management (EIM)
[sc_icon_with_text icon=”mapping” icon_shape=”circle” icon_color=”#ffffff” icon_background_color=”#52a6ea” icon_size=”big” level=”h3″]
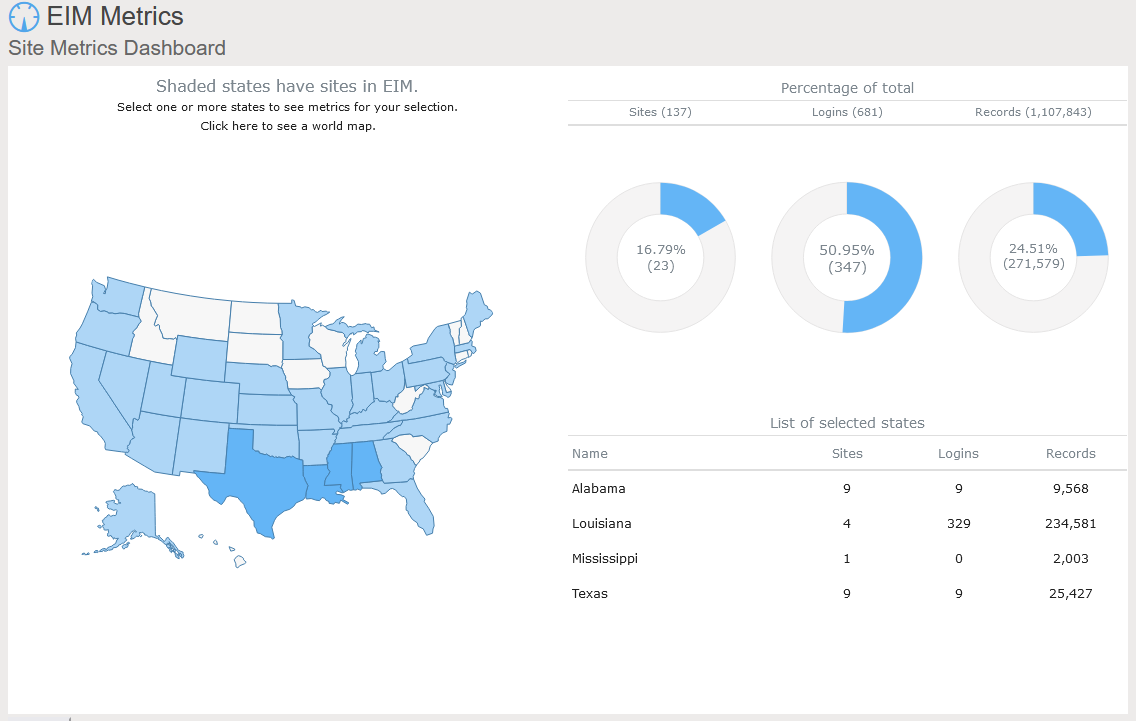
1. New Site Metrics dashboard allows immediate visibility into your data with clickable mapping. This is especially powerful for customers with multiple sites where they want to keep track of site activity and usage. [/sc_icon_with_text]
[sc_icon_with_text icon=”multisite-view” icon_shape=”circle” icon_color=”#ffffff” icon_background_color=”#9ac63f” icon_size=”big” level=”h3″]
2. Finding data can sometimes be overwhelming especially when you have hundreds, if not thousands, of locations and numerous analytical parameters to review. Locus added advanced database search tools to support multiple search terms and ‘exact match’ searches, making it easy to find exactly what you want with a couple of key words and a click. Never has finding the right results from large complex datasets been so easy. [/sc_icon_with_text]
[sc_icon_with_text icon=”integration-service” icon_shape=”circle” icon_color=”#ffffff” icon_background_color=”#3766b5″ icon_size=”big” level=”h3″]
3. Locus has enhanced its API functionality to enable easier integration with external BI tools, including Tableau, PowerBI, and other apps. Now, customers that rely on external business analytical tools will have quick and easy access to data to combine with other internal data sources. [/sc_icon_with_text]
[sc_icon_with_text icon=”locus-docs” icon_shape=”circle” icon_color=”#ffffff” icon_background_color=”#52a6ea” icon_size=”big” level=”h3″]
4. Locus document management has been taken to the next level by allowing customers to link documents from any external library directly into their sites, monitoring locations, samples, and more. This means with a simple click, users can go to lab reports, regulatory reports, and any other current or historical document associated with the site. If you are using SharePoint, for example, to manage documents – they can be accessed directly from Locus software. Document access and security will be preserved by existing document library access controls. [/sc_icon_with_text]
[sc_icon_with_text icon=”help” icon_shape=”circle” icon_color=”#ffffff” icon_background_color=”#9ac63f” icon_size=”big” level=”h3″]
5. 2022 was the year of “help”. In addition to the advanced search, Locus added a new Help Browser to provide access to comprehensive documentation for every feature of the software. It is similar to the familiar “site map”, only the links take you to help content. With this new feature, users can view help in a single location vs having to access the information on each individual screen. For new users, or infrequent users, this will be their new favorite feature. [/sc_icon_with_text]

EHS & ESG Solutions
[sc_icon_with_text icon=”material-consumption” icon_shape=”circle” icon_color=”#ffffff” icon_background_color=”#52a6ea” icon_size=”big” level=”h3″]
1. Locus’ Survey/Questionnaire tool enables you to securely & easily obtain data globally without the burdens of training or maintaining user lists. The survey system effortlessly supports data entry from external organizations (such as suppliers) or even occasional users internal to your organization, with a simple link click. [/sc_icon_with_text]
[sc_icon_with_text icon=”drag-up–down” icon_shape=”circle” icon_color=”#ffffff” icon_background_color=”#9ac63f” icon_size=”big” level=”h3″]
2. Locus released a new pivot table tool that enables you to perform full data analysis on any query in the system. Data may be grouped and organized by any value. Output options include bar charts, heatmaps, tables, area charts, scatter charts, and tree maps. In support of the output options, Locus has improved the ability for users to create dashboards more easily. [/sc_icon_with_text]
[sc_icon_with_text icon=”audit” icon_shape=”circle” icon_color=”#ffffff” icon_background_color=”#3766b5″ icon_size=”big” level=”h3″]
3. Complex inspection and audit forms require branching, sophisticated, scoring, and automated responses. Locus added new question types to its inspection/ audit module, including conditional questions based on responses to one or more previous questions. Locus augmented the scoring calculation mechanism and automated creation and tracking of corrective action. [/sc_icon_with_text]
[sc_icon_with_text icon=”tasks” icon_shape=”circle” icon_color=”#ffffff” icon_background_color=”#52a6ea” icon_size=”big” level=”h3″]
4. In today’s world, users need access to environmental data on the go. Locus augmented its mobile offerings to include configurable layouts for mobile users, with compact forms specially designed for smartphone and tablet access. [/sc_icon_with_text]
[sc_icon_with_text icon=”manage-entities” icon_shape=”circle” icon_color=”#ffffff” icon_background_color=”#9ac63f” icon_size=”big” level=”h3″]
5. Today’s managers want immediate access to the data they need. Locus’ new Landing Page feature makes it simple to configure the dashboards, bookmarks, and record lists. This enables the user to review just the areas they need to see and navigate efficiently to complete the work. [/sc_icon_with_text]
Contact us to see a demo of Locus software and get a quote
Today is GIS Day, a day started in 1999 to showcase the many uses of geographical information systems (GIS). Earlier Locus blog posts have explained how GIS and maps support visualization of objects in space and over time. This post covers a specific visualization method called data dashboards.
A data dashboard is a combination of charts, maps, text, and images that enables analysis of data and thereby promotes discovery of previously unknown relationships in the data. Companies and organizations use dashboards to develop insight into the overall status of a company or of a company division, process, or product line. Dashboards are also a common function in ‘business intelligence’ applications such as Microsoft Power BI and Tableau. A printed dashboard is static, but an online dashboard can be dynamic; in a dynamic dashboard, interacting with one item on the dashboard causes the other items to update. Taken together, the visualizations on a dynamic dashboard can help you find the story in your data.
One reason dashboards are so helpful is that they allow humans to partially ‘offload’ their thinking. Cognitive research has shown that human ‘working memory’ handles at most four items at a time. A good visualization, however, reduces the number of items to process in memory.
Consider a large table of carbon dioxide emissions by country for multiple years; it can be difficult to keep all the numbers in mind if you are trying to find trends.

If you plot the data in a graph, however, each series of data in the chart becomes just one line on the graph. It is much easier to compare lines on the chart than to compare columns of numbers.

Now consider making a map with countries color coded by emissions. Again, for each country, the map reduces multiple numbers to a single color for that country on the map. You can compare country colors more easily than columns of numbers.

A dashboard that combines multiple visualizations further enhances data analysis. Imagine a dynamic dashboard showing you both the emissions chart and map described above. If you select a country on the map, the chart can highlight the line for that country, so you compare its emissions to other countries over time. Similarly, if you select a line on the chart for a specific country, the map can highlight the selected country to show how its emissions compare to nearby countries. This interactivity lets you drill into your data more effectively than using either the chart or the map by itself.
Here are three examples of effective dashboards that are available online:
- The Covid-19 dashboard from John Hopkins shows a map, charts, and tables of Covid -19 cases.
- The Global Climate Dashboard from NOAA shows charts of multiple climate indicators.
- The Carbon Pricing dashboard from the World Bank lets you drilldown to see carbon pricing initiatives for various nations.
Locus includes data dashboards in our applications. One example is the Site Metrics dashboard in EIM, Locus’s cloud-based, software-as-a-service application for environmental data management. The Site Metrics dashboard lets you perform roll-up queries across your portfolio of sites. A map on the dashboard shows all states with active sites. If you select one or more states, the dashboard updates the charts and tables on the right to show total sites, user logins, and record counts. Other dashboards can support showing sample locations of certain chemicals or counts of regulatory limit exceedances.
A further example comes from the Locus Environmental Social and Governance (ESG) application. ESG metrics are becoming increasingly important measures for an organization’s performance. Data dashboards can help companies quickly visualize trends in their ESG metrics using intuitive mapping tools.

This dashboard illustrates both spatial and time trends and provides the raw data necessary for auditability and transparent decision making. Having these features on a single combined view provides users with instant access to the key inputs for ESG prioritization, planning, and project implementation.
As these examples from Locus show, data dashboards with integrated mapping are important tools for maximizing the value of your collected environmental and ESG data. For any dataset with a geographic component, it’s important to incorporate mapping elements in the outputs, to highlight trends and patterns that may not otherwise be visible in a chart or table. Modern software can combine these output formats in a way that tells the story shown by your data.
Interested in Locus’ GIS solutions?
Locus GIS+ features all of the functionality you love in EIM’s classic Google Maps GIS for environmental management—integrated with the powerful cartography, interoperability, & smart-mapping features of Esri’s ArcGIS platform!
[sc_button link=”https://ltweb-stage.locustec.com/applications/gis-mapping/” text=”Learn more about Locus’ GIS solutions” link_target=”_self” color=”#ffffff” background_color=”#52a6ea” centered=”1″]
[sc_image width=”150″ height=”150″ src=”16303″ style=”11″ position=”centered” disable_lightbox=”1″ alt=”Dr. Todd Pierce”]
About the Author—Dr. Todd Pierce, Locus Technologies
Dr. Pierce manages a team of programmers tasked with development and implementation of Locus’ EIM application, which lets users manage their environmental data in the cloud using Software-as-a-Service technology. Dr. Pierce is also directly responsible for research and development of Locus’ GIS (geographic information systems) and visualization tools for mapping analytical and subsurface data. Dr. Pierce earned his GIS Professional (GISP) certification in 2010.
To celebrate a milestone 25 years of success in EHS and ESG software development, we sat down with Locus President, Wes Hawthorne for a brief discussion. In this post, we ask him a series of questions highlighting the past, present and future of EHS and ESG.
1. What are the greatest challenges that environmental professionals are facing?
One of the persistent challenges we’ve seen for the past 25 years is that the responsibilities of environmental professionals are continually expanding. Previously, almost all environmental work was localized, with facility-level permits for air, water, waste, etc. That has expanded over the years to include new regulations and reporting requirements for sustainability, social metrics, and other new compliance areas, while the old facility-level programs still continue. This has led to more pressure on environmental managers to keep up with these programs, and increased reliance on tools to manage that information. That’s where Locus has always focused our effort, to make that ever-expanding workload more manageable with modern solutions.
2. What are the most interesting trends in EHS and ESG?
The current flood of interest in ESG is certainly notable as far as bringing corporate attention to the environmental field, as well as having requirements originate from the SEC here in the US. We have become accustomed to managing oversight from multiple regulatory bodies at the local, state, and federal level, but SEC would be a newcomer in our line of work. Their involvement will be accompanied by a range of new requirements that are common for the financial world, but would be unfamiliar to environmental staff.
Across other EHS fields, we are seeing increased demand for transparency in EHS functions. Overall, this is a positive move, as it brings more attention to EHS issues and develops a better EHS culture within organizations. But this also drives the need for better tools to make EHS information readily available across all levels of the organization.
3. What are the most disruptive technologies available today?
As far as technologies, the ones most likely to have significant impact in the environmental field are ones that don’t require a significant capital investment. Although there are definitely some practical advantages to installing smart monitoring devices and other new technologies, procuring the funding for those purchases is often difficult for environmental professionals. Fortunately, there are still many technologies that have already been implemented successfully in other fields, but only need to be adapted for environmental purposes. Even simple changes like using web-based software in place of spreadsheets can have a huge impact on efficiency. And we haven’t yet seen the full impact of the proliferation of mobile devices on EHS functions. We are still working on new ways to take advantage of mobile devices for data collection, analysis, and communication purposes.
4. What do you think are the biggest innovations of the last 25 years in our field?
We’ve seen a number of innovation milestones in the past 25 years, and while we didn’t invent SaaS, we’ve been largely responsible for adapting it and perfecting it for environmental purposes. One of the major innovations we’ve integrated into our products include online GIS tools where users can easily visualize their environmental data on maps without expensive desktop software. Another one was our fully configurable software platform with built-in form, workflow, and report builders tailored for environmental purposes, which allows anyone to build and deploy environmental software applications that exactly match their needs. There have been many other innovations we’ve incorporated into our software, but these two stand out as the most impactful.
5. Where do you see Environmental and ESG reporting in the future?
More and more, we are seeing all types of reporting being converted into pure data exchanges. Reports that used to include regulatory forms and text interpretations are being replaced with text or XML file submittals. This transition is being driven largely by availability of technology for EHS professionals to generate and read these files, but it is also promoted by regulatory agencies and other stakeholders receiving these reports. Stakeholders have less time to read volumes of interpretive text, and are becoming more skeptical of potential bias in how facts are presented in text. These are driving the need for more pure data exchanges, with increasing emphasis on quantifiable metrics. These types of reports are also more readily compared against regulatory or industry standards. For reporters, lengthy corporate reports with volumes of text and graphics are becoming less common, and the success of an organization’s programs will be increasingly reliant on robust data sets, since ultimately only the data will be reported.
6. What has been the key reason for Locus’ success for the past 25 years?
There are actually a few that immediately come to mind. One reason is the nature of our continually evolving products. By providing our solutions as SaaS, our software adapts with new environmental requirements, and with new technologies. If our software was still the same as it was 25 years ago, it simply wouldn’t be sufficient for today’s requirements. Since our software is updated multiple times each year, it is difficult to notice the incremental changes, but they can be readily seen if you compare today’s software with the original in 1997. And we’re committed to continuing the development of our products as environmental needs change.
The other primary reason for our success is our excellent staff and the environmental expertise we bring to our customers. We simply could not provide the same level of support without our team of environmental engineers, scientists, geologists, chemists, and an array of others. Having that real-world understanding of environmental topics is how we’ve maintained customer relationships for multiple decades. And our software only has value because it is maintained and operated by staff who appreciate the complexity and importance of environmental work.
 Mr. Hawthorne has been with Locus since 1999, working on development and implementation of services and solutions in the areas of environmental compliance, remediation, and sustainability. As President, he currently leads the overall product development and operations of the company. As a seasoned environmental and engineering executive, Hawthorne incorporates innovative analytical tools and methods to develop strategies for customers for portfolio analysis, project implementation, and management. His comprehensive knowledge of technical and environmental compliance best practices and laws enable him to create customized, cost-effective and customer-focused solutions for the specialized needs of each customer.
Mr. Hawthorne holds an M.S. in Environmental Engineering from Stanford University and B.S. degrees in Geology and Geological Engineering from Purdue University. He is registered both as a Professional Engineer and Professional Geologist, and is also accredited as Lead Verifier for the Greenhouse Gas Emissions and Low Carbon Fuel Standard programs by the California Air Resources Board.
Want to discuss EHS and ESG solutions with our product specialists? Contact us today!
There are two promising technologies that are about to change how we aggregate and manage EHS+S data: artificial intelligence (AI) and blockchain. When it comes to technology, history has consistently shown that the cost will always decrease, and its impact will increase over time. We still lack access to enough global information to allow AI to make a significant dent in global greenhouse gas (GHG) emissions by merely providing better tools for emissions management. For example, the vast majority of energy consumption is wasted on water treatment and movement. AI can help optimize both. Along the way, water quality management becomes an add-on app.
AI is a collective term for technologies that can sense their environment, think, learn, and act in response to what they’re detecting and their objectives. Possible applications include (1) Automation of routine tasks like sampling and analyses of water samples, (2) Segregation of waste disposal streams based on the waste containers content, (3) Augmentation of human decision-making, and (4) Automation of water treatment systems. AI systems can greatly aid the process of discovery – processing and analyzing vast amounts of data for the purposes of spotting and acting on patterns, skills that are difficult for humans to match. AI can be harnessed in a wide range of EHS compliance activities and situations to contribute to managing environmental impacts and climate change. Some examples of applications include permit interpretation and response to regulatory agencies, precision sampling, predicting natural attenuation of chemicals in water or air, managing sustainable supply chains, automating environmental monitoring and enforcement, and enhanced sampling and analysis based on real-time weather forecasts. Applying AI in water resource prediction, management, and monitoring can help to ameliorate the global water crisis by reducing or eliminating waste, as well as lowering costs and lessening environmental impacts. A similar analogy holds for air emissions management.
The onset of blockchain technology will have an even bigger impact. It will first liberate data and, second, it will decentralize monitoring while simultaneously centralizing emissions management. It may sound contradictory, but we need to decentralize in order to centralize management and aggregate relevant data across corporations and governmental organizations without jeopardizing anyone’s privacy. That is the power of blockchain technology. Blockchain technology will eliminate the need for costly synchronization among stakeholders: corporations, regulators, consultants, labs, and the public. What we need is secure and easy access to any data with infinite scalability. It is inevitable that blockchain technology will become more accessible with reduced infrastructure over the next few decades. My use of reduced architecture here refers to a replacement of massive centralized databases controlled by one of the big four internet companies using the hub-and-spoke model concept with a device-to-device communication with no intermediaries.
This post was originally published in Environmental Business Journal in June of 2020.
Locus looks back on the last 25 years of pioneering EHS, ESG, and water quality software.
MOUNTAIN VIEW, Calif., 11 April 2022 — Locus Technologies, the leading EHS Compliance and ESG software provider, today celebrates the 25th anniversary of its founding, and with it, a quarter-century of customer success. Locus looks back on its founding as a Silicon Valley leader in EHS & ESG software with pride in its leadership through expertise, stability, and innovation.
Locus was founded in 1997 with a revolutionary vision that set the framework for what is now widely known as environmental, social, and corporate governance (ESG) and environmental, health, and safety (EHS). Locus envisioned a simplified and data-driven approach, offering software in the cloud, on mobile devices, and as a service. The company pioneered SaaS (Software as a Service) model in EHS, ESG, and water quality management spaces in 1999 and never installed its software on customers’ premises.
Over 25 years, Locus has pioneered cloud environmental solutions, online and mobile GIS (Geographic Information System) services, has revolutionized environmental information management, and AI and IoT technologies for organizations ranging from Fortune 500 companies to forward-facing municipalities and the US Government.
Locus recently broke new ground by releasing the first Visual Calculation Engine for ESG Reporting. Locus’s visual calculation engine helps companies quickly set up and view their entire ESG data collection and reporting program, enabling full transparency and financial-grade auditability throughout the entire process.
As the industry continues to evolve, competitors merge and disappear. New markets emerge and grow. Locus remains a constant in the environmental space, an innovative and independent pioneer.
“For 25 years now, Locus has brought together industry-leading experts in EHS, sustainability, and technology. Although regulations and requirements have changed over the years, that combination remains at the core of what Locus does, as demonstrated by our stability and long-term customer partners. We look forward to continuing our path of growth using those same values for the next 25 years.” said Wes Hawthorne, Locus President.
Locus Founder and CEO, Neno Duplan is proud to look back on the growth of Locus over the last 25 years. He said, “Locus did not start in the clouds, but back in 1997, we had a rather good view. Locus’s vision for better global environmental stewardship has not changed since its inception. We focus on empowering organizations to track better and mitigate the environmental impact of their activities. That vision has come to fruition through the Locus software services used by some of the world’s largest companies and government organizations. Locus’ SaaS has been ahead of the curve in helping private and public organizations in not only managing their water quality, EHS compliance or ESG reporting but also turning their environmental information into a competitive advantage in their operating models.”