Environmental Business Journal (EBJ) recognized Locus for ESG software growth and innovation.

MOUNTAIN VIEW, Calif., 24 February 2022 — Locus Technologies, the leading EHS Compliance and ESG software provider, was awarded a 16th consecutive award from Environmental Business Journal (EBJ) for growth and innovation in the field of Information Technology in the environmental software with particular focus on ESG.

EBJ is a business research publication providing strategic business intelligence to the environmental industry. Locus received the 2021 EBJ Award for Information Technology by growing and innovating its unified EHS compliance and ESG software platform.

In 2021 Locus took a leading market position in the fast-growing space of ESG software. Locus’s ESG SaaS covers carbon data aggregation via a powerful visual calculation engine, investor-grade emissions calculations audit capabilities, reporting to multiple standards from a single data set, integration APIs, dashboards, and carbon reduction goal setting and tracking. This separates Locus from competitors as customers demand integrated net-zero ESG software that supports investor-grade data in disclosure rules such as the EU’s corporate sustainability reporting directive, mandatory TCFD reporting, and anticipated SEC action on climate disclosures.

In 2021 Locus continued to expand its ESG SaaS to include built-in business intelligence tools allowing for interactive, actionable insights into EHS and ESG data, forecasting tools to predict future ESG reporting, APIs linking to utility meters, and interfaces with other Locus and third-party systems that house ESG data. Locus’s ESG application is focused on “enter once, report many times.” The gold standard for multinational enterprises with many locations worldwide is to have a system configured to report to multiple organizations and many standards from a single dataset. Essential built-in reporting in the Locus ESG app includes state or federal regulations, internal CSR, and ESG based on whatever standard their organization adheres to, such as CDP, GRI, SASB, TCDF, or more recent World Economic Forum (WEF) attempt to standardize many voluntary standards.

Locus also expanded its ESG consulting expertise by becoming the first and only software provider to offer accreditation services under new Oregon DEQ guidelines requiring third-party verification for GHG and CFP programs.

Besides strong growth in ESG space, Locus also continues to lead the software for water quality management market with the addition of new SaaS customers in 2021, such as the City of Hillsboro, Oregon for water quality management and Westinghouse Electric Company for control of environmental and radionuclides data, cementing Locus’s market leader position in the space of nuclear facilities.

“Locus’s investment in integrated carbon management software and EHS compliance is paying off. As one of the early SaaS leaders in net-zero digital solutions for ESG reporting, Locus continues to provide value to companies that want to be credible with their carbon reporting and sustainability software.,” said Grant Ferrier, president of Environmental Business International Inc. (EBI), publisher of Environmental Business Journal.

“We would like to thank EBJ for recognizing Locus for a 16th consecutive year and for taking note of our industry-leading ESG software. We aim to continue expanding our software offerings to customers in 2022,” said Wes Hawthorne, President of Locus Technologies.

In providing water quality data management software to organizations serving millions of customers a day, our experts have found some common red flags in alternative solutions. Many alternatives to Locus are more prohibitive than helpful, leading to more issues than they should. Your organization deserves to reduce the stress of data entry, regulatory and voluntary reporting, and more. Here are the top 5 signs that your organization is using outdated water quality software:

1. You’re transcribing data more than once or still using paper forms.

In order to ensure the highest level of data quality, you should not be risking human error at multiple levels. Enter your data once, and have it audit-ready, set to go on regulatory and voluntary reports, which are created directly from Locus Software.

2. Product support is not helmed by specialists who support you adequately after implementation.

Support doesn’t end after implementation. What we often hear from our customers when they switch from other providers is that they are delighted with the level of support that Locus brings with our software. Locus is proud to have the expertise and experience to back our software, and if there is anything you need, you can be sure that Locus support can get it done smoothly.

3. Your software has regular or unexpected downtimes.

You need reliability. Your software should be available to you on-demand. Locus is proud to be the only environmental software developer to publicly share our uptime, which is over 99.9%. If you are experiencing downtimes at inconvenient times or for long periods, you should switch.

4. It’s not mobile-enabled.

Field collection is key for most organizations managing water quality data. You should be able to enter that data into your system once, and from anywhere, reducing errors and extra time doing the same work twice (or more!). Also, being able to access historical data at your fingertips can help you solve problems on the fly.

5. It doesn’t provide actionable insights.

Sure, you may have all of your data collected, but what are you doing with it? If your software is not giving you meaningful findings from analyzing your data, then you are always going to be playing catch-up. Having the tools to help your organization look forward is essential in selecting water data management software.

Want to learn more about our Water Data Management Solution? Reach out to our product specialists today!

    Name

    Company Email

    Phone

    Tell us about your company's needs

    Locus is committed to preserving your privacy.

    Today is GIS Day, a day started in 1999 to showcase the many uses of geographical information systems (GIS). Earlier blog posts by Locus Technologies for GIS day have shown how GIS supports cutting-edge visualization of objects in space and over time. This year’s post explains how GIS supports augmented reality.

    Augmented reality (AR) is a technology that enhances how we experience the real world by overlaying your surroundings with computer-generated objects. It differs from virtual reality (VR) because in VR, everything you see is computer generated, but in AR, the majority of what you see is real – your experience of reality is enhanced (augmented) but not totally replaced.

    You are probably familiar with one AR application already if you watch American football. The ‘virtual’ first down line that appears on field before each play is projected there by computer and is not really painted on the field. If you follow soccer (or football to the rest of the world), AR is used by a Video Assistant Referee (VAR) to objectively determine tight offsides decisions. Digital lines are drawn across the field to show whether or not attackers are illegally past the last defender or not. Another AR example is the popular game Pokémon Go that shows cute virtual creatures in your living room or your front yard.

    To experience AR, you need something to project the non-real objects onto your view of the world. Many AR applications use mobile phones or other devices. An AR application uses the camera view to show you the world around you and then overlays virtual objects onto the view. Other devices such as head mounted displays, ‘smart glasses’, or even ‘bionic contact lenses’ can use AR, but have not been as popular as phones or other mobile devices. In contrast to AR, VR cannot be fully supported with just a mobile device and usually requires headsets to immerse you in a virtual world. Because of this need, AR is much less intrusive than VR is.

    Countless other examples of AR already exist in many fields. A few selected applications include:

    • Online shoppers at some e-commerce sites can use smart devices to project furniture into their home to see how the pieces look before making a purchase.
    • Some clothing stores can project clothing onto shoppers’ bodies to check appearance without having to change clothes. These applications require the user to be in a special dressing booth with full body scanning capabilities.
    • Urban planners use AR to display how planned buildings, cell towers, wind turbines, and other structures would look in the existing space. Planners can walk the streets and view how proposed projects would alter the existing cityscape.
    • AR is used in manufacturing to display operation and safety instructions in a worker’s field of vision using head mounted displays, which circumvents the need to refer to bulky paper manuals.
    • Utility managers can see underground pipelines, water lines, sewer pipes, electrical lines, and other infrastructure projected below their feet.

    So how does GIS relate to AR? There are three main uses of GIS in AR:

    • Location: Any AR application must know where the user is and where to place virtual objects. In most cases, full GIS capabilities are not needed; instead, the application accesses a GPS (global positioning system) to find locations. Consider the Pokémon Go application mentioned before. The game knows where the various Pokémon need to appear. When a user plays the game, it uses GPS to find the user, and then shows any Pokémon that are near the user based on their locations.
    • Layers: An AR application may need to show features that are not visible to the user, such as underground electrical lines, earthquake fault lines, property lines, or planned buildings. All these features can be stored as GIS map layers in the cloud and then displayed in the AR application as virtual overlays projected on the real world. Furthermore, a user could select a displayed item and view related attribute information in the GIS layer. For example, a user could view the condition, age, and repair status of a selected water pipeline.
    • Navigation: An AR application may also need to help a user get from point A to point B, for example in a crowded airport or in a large warehouse. Such navigation could be facilitated by showing virtual route markers and arrows on the real world.

    Locus has been exploring environmental uses of AR and GIS by adding AR to Locus Mobile, which is the Locus app for collecting field data, completing EHS audits, tracking waste containers, and completing other tasks requiring users to gather data out of the office. Locus Mobile now features an AR mode to assist users when taking field samples. When the user activates AR mode, the app uses the camera to show the user’s immediate area. The app then puts multiple virtual markers on the display corresponding to sampling points located in that direction. As the user moves or rotates the phone to change the viewing area, the markers change to reflect the locations in the user’s line of sight. Clicking a marker provides more information including the location name and the distance from the user.

    Locus Mobile uses all three ways to combine GIS with AR:

    • By using GPS to find the user’s location and the locations of nearby sampling points.
    • By using GIS to display the layer of sampling points.
    • By using GIS to assist with navigation to sampling points by showing distance and direction.

    Here is a sample image from Locus Mobile showing three nearby sampling locations along with information about past events or measurements at the locations. The three blue banners are the augmented reality displayed on top of the view of the nearby surroundings.

    Locus Augmented Reality

    By using GIS and AR to assist users in finding sampling points, Locus Mobile makes field personnel more productive. Samplers can find field locations quickly and can easily pull up related information. Locus continues to explore using AR to expand the functionality of its environmental applications.


    Interested in Locus’ GIS solutions?

    Locus GIS+ features all of the functionality you love in EIM’s classic Google Maps GIS for environmental management—integrated with the powerful cartography, interoperability, & smart-mapping features of Esri’s ArcGIS platform!

    [sc_button link=”https://ltweb-stage.locustec.com/applications/gis-mapping/” text=”Learn more about Locus’ GIS solutions” link_target=”_self” color=”#ffffff” background_color=”#52a6ea” centered=”1″]


    [sc_image width=”150″ height=”150″ src=”16303″ style=”11″ position=”centered” disable_lightbox=”1″ alt=”Dr. Todd Pierce”]

    About the Author—Dr. Todd Pierce, Locus Technologies

    Dr. Pierce manages a team of programmers tasked with development and implementation of Locus’ EIM application, which lets users manage their environmental data in the cloud using Software-as-a-Service technology. Dr. Pierce is also directly responsible for research and development of Locus’ GIS (geographic information systems) and visualization tools for mapping analytical and subsurface data. Dr. Pierce earned his GIS Professional (GISP) certification in 2010.

    Are stricter PFAS standards coming your way?

    PFAS chemicals were first invented in the 1930s and have since been used in several applications from non-stick coatings to waterproof fabrics to firefighting foams. In recent years, PFAS studies and research funding have increased remarkably, but as of right now the EPA has yet to implement regulations on the chemicals. Many states have leapfrogged the EPA by implementing regulations on PFAS use, safe PFAS levels in drinking water, and by suing manufacturers of PFAS chemicals. This creates a complex set of regulatory requirements, depending on where you operate.

    Updated August 30, 2021

    PFAS Lawsuits and Drinking Water Limits in US

    Locus offers software solutions for PFAS management and tracking. Our EHS software features tools to manage multiple evolving regulatory standards, as well as sample planning, analysis, validation, and regulatory reporting—with mobile and GIS mapping functionality. Simplify tracking and management of PFAS chemicals while improving data quality and quality assurance. With future PFAS regulations being an inevitability, the time is right to adopt a software that can track and manage these and other chemicals.

    Contact us to see Locus’ PFAS management solution

      Name

      Company Email

      Phone

      Tell us about your company's needs

      Locus is committed to preserving your privacy.

      Locus Technologies founder and CEO Neno Duplan provides a wealth of experience on water quality in the cloud. Neno began cloud-based data work before any of us knew what the cloud even was. He does a great job explaining the steps needed to undertake and the significant benefits of a cloud-based digital transformation, and much more!

      Locus water quality software is designed for water system owners and operators to simplify the sampling, management, tracking, and regulatory reporting of drinking water data. The built-in CCR module streamlines a complex and often tedious process of preparing the annual calculations required for the report, which is a win-win for the water systems and consumers.

      Locus CCR Prep | Consumer Confidence Reports

      Screenshot of EIM water utility dashboard and mobile app for locations

      Contact us to see a demo of the Drinking Water app

        Name

        Company Email

        Phone

        Tell us about your company's needs

        Locus is committed to preserving your privacy.

        Humankind has produced hundreds of millions of tons of plastics since the 1950s. A relatively small proportion of these plastics (less than 10%) has been recycled; some has been incinerated; and a significant amount has been entombed in landfills. A small, but significant proportion of those plastics end up as microplastics (plastic particles less than 5 microns in size). Experts estimate that as many as 1.5 million tons of microplastics are released to surface water (oceans, rivers, lakes) every year. These particles don’t readily break down in the environment—which means they accumulate in the water.

        So what does that mean? If even half of the microplastics that entered the waters over the last 10 years are still there, and they are evenly distributed across all the water on Earth, it means that every liter of water on the planet has over 500 tiny pieces of plastic floating around in it.


        Of course, the plastic isn’t evenly distributed—we haven’t contaminated the deep oceans to the same extent we’ve contaminated rivers, lakes and other surface waters, from which we draw our drinking water. The World Health Organization (WHO) recently reported that studies of drinking water show it contains up to 1000 particles/L. WHO showed that the two most common plastic particle were PET (polyethylene terephthalate), commonly found in clothing and food containers, and polypropylene (bags, packaging and some fibers).

        People don’t know how bad these are. General consensus among experts is it depends on the type of plastics: polyethylene is probably not bad, phthalates are worse, and chlorinated compounds such as vinyl chloride are far worse.

        Regulators are starting to take notice: REACH in EU and CA both have proposed regulations for microplastics in drinking water. The REACH regulations attack the problem at the source. They include measurement of microplastics that are shed from clothing and fibers, which are the source of up to 35% of the microplastics in the environment. California will likely start with a preliminary guideline to help water suppliers measure and assess the microplastics in their systems.

        As a drinking water supplier, you need to be prepare to manage microplastics. A good first step is having a flexible software system such as Locus, in place to track microplastics. The system should track the sampling and lab methodology as well as the data results, so you can continue not just to track your data, but assess its meaning in the face of evolving regulations and methodologies.

        As a consumer of water, begin by cutting down on plastics usage. Wear cotton or other apparel which doesn’t include synthetics.

        [sc_image width=”150″ height=”150″ src=”23376″ style=”11″ position=”centered” disable_lightbox=”1″ alt=”Steve Paff”]

        About the Author—Steve Paff, Locus Technologies

        Steve Paff is a Sales Engineer, Product Manager and Implementation specialist with over 25-years’ experience delivering quality software solutions for environmental, health, safety and sustainability. Mr. Paff has extensive experience in many of the industry’s software suites. He came to Locus as Senior Sales Engineer after developing and launching a Covid-19 contact tracing app and developing an app to track sustainability metrics across the global apparel supply chain.

        [sc_button link=”https://ltweb-stage.locustec.com/applications/environmental-information-management/drinking-water-quality/” text=”See drinking water solutions” link_target=”_self” color=”#ffffff” background_color=”#52a6ea” centered=”1″]

        Attention all water providers: the EPA’s UCMR 5 list includes 30 contaminants (29 PFAS and lithium) that both small and large water systems have to test for and report. Can your current environmental solution handle it?

        Locus EIM environmental software can handle new chemicals and analyses seamlessly. Both the standard Locus EIM configuration and the Locus EIM Water configuration (specially tailored to water utilities) are built with ever-changing regulations in mind.

        We’ve put together some helpful background and tips for water providers preparing for UCMR 5 monitoring.

        What water providers need to know

        • The fifth and latest list (UCMR 5) was published on March 11, 2021, and includes 30 new chemical contaminants that must be monitored between 2023 and 2025 using specified analytical methods.
        • SDWA now requires that UCMR include all large PWSs (serving >10,000 people), all PWSs serving between 3,300 and 10,000 people, and a representative sample of PWSs serving fewer than 3,300 people.
        • Large systems must pay for their own testing, and US EPA will pay for analytical costs for small systems.
        • Labs must receive EPA UCMR approval to conduct analyses on UCMR 5 contaminants.

        EPA UCMR 5 Infographic

        [sc_icon icon=”download” shape=”square” size=”small” link=”https://ltweb-stage.locustec.com/wp-content/uploads/2021/03/locus_infographic_ucmr5.jpg” link_target=”_self”] Download Infographic

        What’s the UCMR and why are some contaminants unregulated?

        In 1996, Congress amended the Safe Drinking Water Act with the Unregulated Contaminant Monitoring Rule (UCMR). Under this new rule, US EPA can require water providers to monitor and collect data for contaminants that may be in drinking water but don’t have any health-based standards set (yet) under the SDWA.

        More than 150,000 public water systems are subject to the SDWA regulations. US EPA, states, tribes, water systems, and the public all work together to protect the water supply from an ever-growing list of contaminants.

        However, under the UCMR, US EPA is restricted to issuing a new list every five years of no more than 30 unregulated contaminants to be monitored by water providers.

        This helps reduce the burden on water providers, since monitoring and testing for the existing long list of regulated contaminants already requires a significant investment of time and resources.

        Throughout the course of this monitoring, US EPA can determine whether the contaminants need to be officially enforced— but this would require regulatory action, routed through the normal legislative process.

        Tips for managing UCMR in Locus EIM logo

        • DO use EIM’s Sample Planning module to set your sample collection schedule ahead of time, as requirements vary and are on specific schedules
        • DO take advantage of EIM’s sample program features to track and manage UCMR data, or consider using a dedicated location group to track results, keeping them separate and easy to find for CCR reporting.
        • DON’T worry about adding in new analytical parameters in advance. With EIM’s EDD loader, you can automatically add them when the data arrive from the laboratory.

        Contact your Locus Account Manager for help setting up your EIM database in advance of your sampling schedule, and we’ll make sure you’re equipped for UCMR 5!

        Not yet a customer? Send us a quick note to schedule a call or a demo to find out how Locus software can completely streamline your water sampling and reporting.

        [sc_button link=”#eimquote” text=”Get a demo of Locus EIM” link_target=”_self” centered=”1″]


        More helpful links:


        [sc_fullwidth background_image=”15039″ background_style=”cover” background_position_horizontal=”center” background_position_vertical=”top” video_background_acpect_ratio=”16:9″ container=”1″]

        Get a demo

          Name

          Company Email

          Phone

          Tell us about your company's needs

          Locus is committed to preserving your privacy.

          [/sc_fullwidth]


          MOUNTAIN VIEW, Calif., 18 February 2021 — Locus Technologies (Locus) is pleased to announce that The City of Hillsboro Water Department, Oregon has selected Locus EIM to centralize their water data management. Hillsboro Water will utilize Single Sign-On (SSO) for added security and Locus Mobile for field data collection.

          Locus EIM is a leading cloud solution for streamlining water quality data. First developed in 1999, Locus EIM was the first SaaS solution for managing analytical data. Locus EIM is a robust solution for planning, collecting, analyzing, and reporting environmental data.

          Hillsboro Water manages four public water systems (Hillsboro, Cherry Grove, Butternut Creek, and the Joint Water Commission) for almost half a million customers, as well as Barney Reservoir. Locus EIM will be used to enhance the tracking and managing of Hillsboro Water’s water quality data, coordination of regulatory requirements, and to aid in making data-driven decisions.

          “Locus EIM allows us to easily plan, record, QA/QC, and manage our water quality data collected from many different labs and routine field sampling. We are excited to have a software that helps us to quickly make data-based decisions to ensure safe and reliable drinking water for our rapidly growing community,” said Sarah Honious, Water Quality Program Coordinator, City of Hillsboro.

          “The City of Hillsboro Water Department has a complex and technical set of water quality and regulatory sampling protocols. By utilizing Locus EIM, they can now make key decisions based on the analysis of their data, improving the daily lives of their customers,” said Wes Hawthorne, President of Locus.

          ABOUT THE CITY OF HILLSBORO WATER DEPARTMENT
          The City of Hillsboro, through its appointed three-member Utilities Commission, owns and operates a municipal drinking water system that serves more than 80 percent of Hillsboro residents and businesses. Its delivery of clean, reliable water protects public health, enables emergency fire protection, and supports the City’s economic vitality. Learn more at Hillsboro-Oregon.gov/Water.

          Contact us to learn more about Locus’ Water solutions

            Name

            Company Email

            Phone

            Tell us about your company's needs

            Locus is committed to preserving your privacy.

            Let’s look back on the most exciting new features and changes made in EIM, Locus’ environmental data management software, during 2020!

            Locus EIM Devices

            [sc_icon_with_text icon=”laptop” icon_shape=”circle” icon_color=”#ffffff” icon_background_color=”#52a6ea” icon_size=”big” level=”h3″]

            1. Expanded EIM API

            Locus expanded the EIM application programming interface (API) to support running any EIM Expert Query. Using a drag and drop interface, an EIM user can create an Expert Query to construct a custom SQL query that returns data from any EIM data table. The user can then call the Expert Query through the API from a web browser or any application that can consume a REST API. The API returns the results in JSON format for download or use in another program. EIM power users will find the expanded API extremely useful for generating custom data reports and for bringing EIM data into other applications.[/sc_icon_with_text]

            [sc_icon_with_text icon=”search” icon_shape=”circle” icon_color=”#ffffff” icon_background_color=”#9ac63f” icon_size=”big” level=”h3″]

            2. Enhanced EIM Search Bar Functionality

            Locus enhanced the usefulness of the EIM search box located at the top right of EIM. A user can now search for a location, field sample, or parameter, and choose from quick links showing any found data records plus related field measurements, groundwater levels, or analytical results. The search box also supports searches across EIM help files. These improvements, along with the existing ability to search for EIM menu items or functions, greatly increase the search bar’s usefulness and make it much easier for users to find what they need. In 2021, Locus plans on further expanding the search bar to allow for generating charts or maps for entered locations or parameters.[/sc_icon_with_text]

            [sc_icon_with_text icon=”gis-plus” icon_shape=”circle” icon_color=”#ffffff” icon_background_color=”#3766b5″ icon_size=”big” level=”h3″]

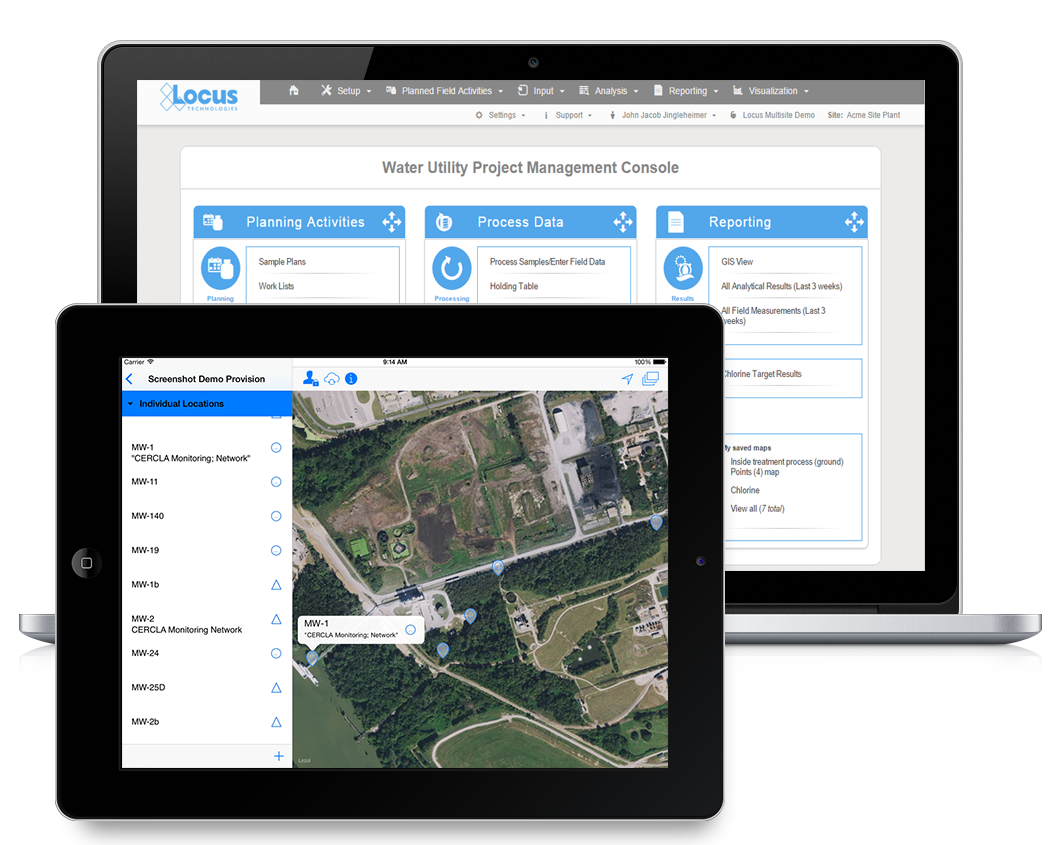
            3. Multisite Support for EIM GIS+

            The EIM GIS+ package brings the power of geographical information systems (GIS) to EIM. In 2020, Locus added multisite support for the GIS+. A user can generate a map showing locations and related results for more than one EIM site at a time. This GIS+ improvement supports cross-site queries and maps, which help greatly with analysis across a portfolio of sites in EIM.[/sc_icon_with_text]

            [sc_icon_with_text icon=”sample-planning” icon_shape=”circle” icon_color=”#ffffff” icon_background_color=”#52a6ea” icon_size=”big” level=”h3″]

            4. Support for Sample Planning Notifications

            Locus rolled a new EIM feature in 2020 to support automated email notifications for sample planning events. Users can subscribe to notifications for unreported analysis groups, parameters, or samples; late and upcoming samples; and compliance samples at risk of being late. Each notification can be tailored for specific plans, events, and tasks, and are set to run for specific time window. With these new notification types, users gain more control over their sample planning and are better notified about potential issues. The new sample planning notifications are available in Water EIM but can be deployed to other customer EIM instances on request.[/sc_icon_with_text]

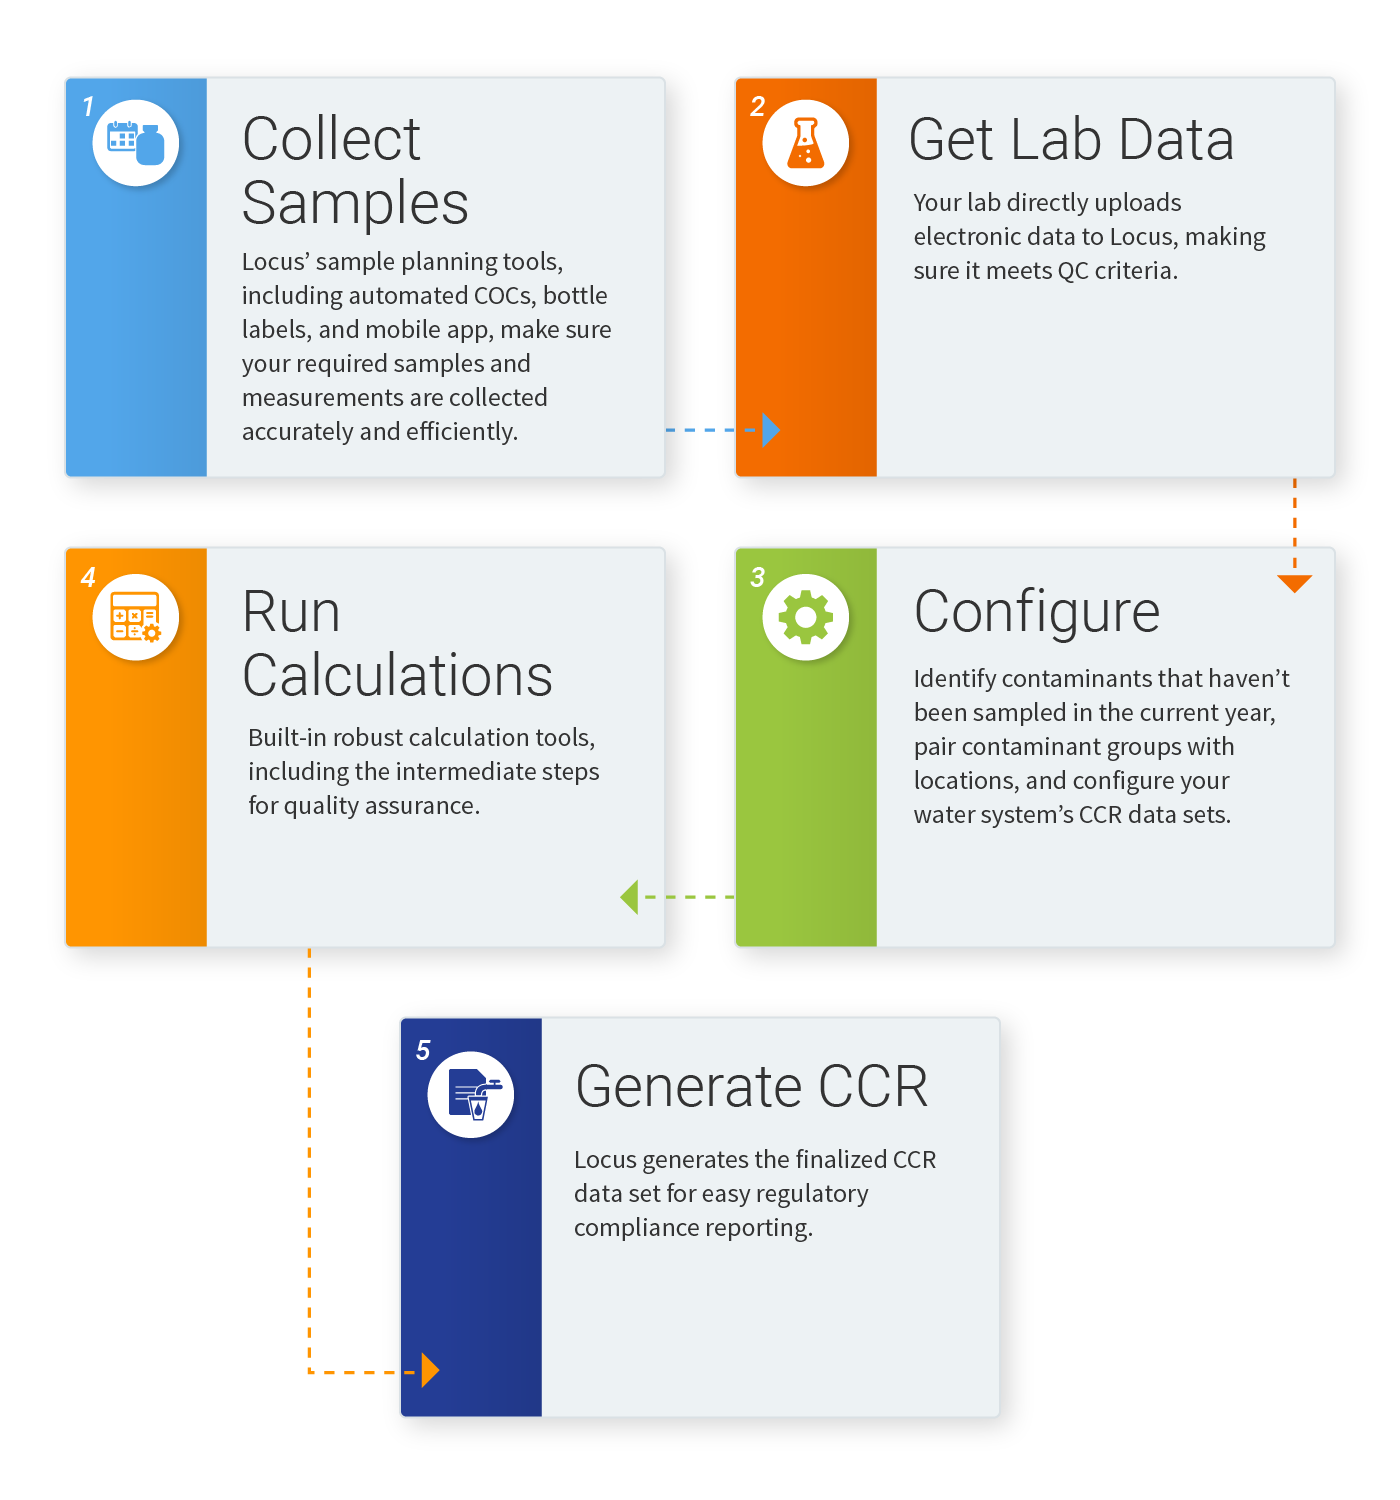
            [sc_icon_with_text icon=”consumer-confidence-report” icon_shape=”circle” icon_color=”#ffffff” icon_background_color=”#9ac63f” icon_size=”big” level=”h3″]

            5. Continued Water EIM Reporting Support

            EIM is the world’s leading water quality management software used since 1999 by many Fortune 500 companies, water utilities, and the US Government. Locus continues to support water utility customers in EIM through multiple updates done to EIM reporting and analysis. From enhanced support for chlorine field data, to incorporating the latest reporting requirements for the Consumer Confidence Report, Locus continues to expand Water EIM functionality while accounting for variable practices that exist among water utility operators.[/sc_icon_with_text]

            [sc_icon_with_text icon=”analytical-view” icon_shape=”circle” icon_color=”#ffffff” icon_background_color=”#3766b5″ icon_size=”big” level=”h3″]

            6. Improved Analytical Views

            Locus continues to upgrade and improve the EIM interface and user experience. In 2020, Locus overhauled the Analytical Views pages in EIM, which support data exports for analytical results as well as laboratory QC samples and results. Multiple EIM menu items were combined into one page that supports all analytical data views. Users are directed through a series of filter selections that culminate in a grid of results. The new page improves usability and provides one centralized place for these data reports.[/sc_icon_with_text]

            [sc_icon_with_text icon=”load-edd” icon_shape=”circle” icon_color=”#ffffff” icon_background_color=”#52a6ea” icon_size=”big” level=”h3″]

            7. Enhanced FTP EDD Loader Abilities

            One of the more powerful modules in EIM is the FTP EDD loader, which lets laboratory users upload multiple analytical EDD files for different sites to a Locus FTP server for batch processing. Lab users do not have to login to EIM to upload each EDD individually. In 2020, Locus augmented this function to support non-analytical EDDs and to accept EDDs from non-lab users. With these changes, any EIM user can upload to the FTP site any number of EDD files in any format for multiple sites. Users may still need to login to EIM to resolve any EDD errors. Interested EIM users should contact Locus to get the needed FTP site credentials.[/sc_icon_with_text]

            [sc_icon_with_text icon=”discharge-monitoring-report” icon_shape=”circle” icon_color=”#ffffff” icon_background_color=”#9ac63f” icon_size=”big” level=”h3″]

            8. Expanded DMR Support

            Locus continues to enhance the Discharge Monitoring Report (DMR) module in EIM. In 2020, Locus implemented calculations needed to handle reporting of divalent metals. Locus also added the Florida DEP ezDMR format. Locus continues to add more formats so customers can meet their reporting requirements.[/sc_icon_with_text]

            [sc_icon_with_text icon=”parameter-limits” icon_shape=”circle” icon_color=”#ffffff” icon_background_color=”#3766b5″ icon_size=”big” level=”h3″]

            9. Improved Parameter Management

            Locus added two new features in EIM to improve support for managing analytical parameters. First, EIM now allows for storing parameter names in the local language and using these translated names in EIM Enhanced Formatted Reports. This function helps non-English customers create reports customized for local users. Second, EIM can handle alternate parameter codes. These ‘aliases’ for the primary parameter code, used in tracking reports and in EDD uploads, ensure that labs are not flagged or penalized for using a parameter code that is synonymous with the expected EIM parameter code.[/sc_icon_with_text]

            [sc_icon_with_text icon=”unit-conversions” icon_shape=”circle” icon_color=”#ffffff” icon_background_color=”#52a6ea” icon_size=”big” level=”h3″]

            10. Improved Unit Conversions

            Locus enhanced the unit conversion functions in EIM in 2020; these functions are used to convert laboratory analytical results to a consistent set of reporting units. EIM now allows for conversion factors that are parameter specific. Second, EIM now lets users define molecular weight multipliers for use in unit conversions that require molecular weight calculations. Both these changes give users more control and transparency over unit conversions in EIM.[/sc_icon_with_text]

            Contact us to see a demo of Locus EIM and get a quote

              Name

              Company Email

              Phone

              Tell us about your company's needs

              Locus is committed to preserving your privacy.